News2016.01.24: (Blog) What is the best way to measure partisan gerrymandering?There have been a number of different methods proposed to measure partisan gerrymandering, but which is the best one? Which is the most reliable? Sounds like a difficult question, even a subjective one, but if we take care to approach it systematically, we might very well reach an objective answer. I have scoured the internet for every method of measuring partisan gerrymandering ever proposed, and even come up with my own. There are suprisingly few:
So, five. That is certainly a few. I have taken it upon myself to analyze all of these proposed measures to find what is the best one to use for Auto-Redistrict. This was all done in my head, however, and I've never -- until now -- taken the time to explain my reasoning. This is still a bit over-summarized, but I hope it is complete enough that you can see how my conclusion was inevitable. STEP 1: Establishing criteriaIn order to figure out what the best way to measure gerrymandering is, we first need to establish some objective criteria to use to judge potential measures by. This may seem a bit "meta", but bear with me. We can start with the obvious, and then move on to properties that would be nice to have. Now the most obvious criteria of all is we want it to detect gerrymanders when there are gerrymanders, and detect that there aren't when there aren't. To make this a little more concrete, there are 4 possibilities:
Notice there are two red squares -- most people don't realize this, but there are two qualitiatively different ways of making an error. These are called "type 1" and "type 2" errors. When we detect a gerrymander when in fact there is no gerrymander, that's called a "false positive" or "type 1" error. When we fail to detect a gerrymander when in fact there is one, that's called a "false negative" or "type 2" error. We want, of course, always the green, and never the red. We want to always detect a gerrymander when there is one, and never count something as a gerrymander when it is not. A measure that fails either of these tests is just no good. The mere fact that we can tell that there was an error implies that there is a less-error prone method available. (If nothing else, the very method we used to identify that there was an error!) So here is our first criteria:
Now the second most obvious criteria is that the result of our measure shouldn't change when things that aren't relevant to what we're interested in changes. For instance, if another Star Wars movie is released, that shouldn't make our measure suddenly say there's a gerrymander when before it did not, or vice versa. This would suggest that there's something very fundamentally flawed with our measure. Now that one was fairly obvious, but there are some less obvious independence requirements. For instance, let's say we want to base a temperature scale off the freezing and boiling points of water. Say, the freezing point is zero degrees and the boiling point is a hundred. Pretty straightforward, you say, nothing wrong with that. That's called Celsius. Ah, but wait - the freezing and boiling point of water changes depending on the ambient pressure. So we have to add in the wording "...at the average pressure of the atmosphere at ground level" to make it so that our measurement of temperature isn't dependant upon the ambient pressure. We want something similiar for our measurement of gerrymandering. It shouldn't be dependent on things like population, average voter turnout, etc. And it definitely shouldn't go from gerrymandered for Dems to gerrymandered for Repubs just because one party was more popular in one election year. That tells us that we either had a false positive or false negative before, or that we do now. If the result changed, then either it was wrong before or it is now. So that's another pass-or-fail rule:
More generally, but not absolutely crucial, is we want a measure of gerrymandering that is generally unaffected by vote swings, at least statistically speaking; at least in the aggregate. We'd also like it to be relatively unaffected by non-uniform vote swings -- by one district swinging one way, while another swings another. We know that this can't be an absolute disconnect, because gerrymandering does depend on the partisanness of districts. So we can't make either of these absolute pass-or-fail criteria. A gerrymander is by definition reliant on partisanness of districts. But still, it would be nice if our measure was at least fairly statistically independent from changes in voter sentiment.
Another property that we would like, but is not strictly neccessary, is "continuosness" or "smoothness". If our measure has gaps in it - areas where it suddenly jumps from one value to another, this strikes us as something we wouldn't intuitively expect, and makes it more difficult to work with. Again, not a pass-or-fail criteria here. A discontinuous measures is better than none, but if two measures are otherwise equal in all other aspects, we'd prefer the continuous one.  A discontinuous function - we'd rather avoid this, but it's not the end of the world.
STEP 2: Evaluating proposed measures based on the criteria
Compactness While compactness (or lack thereof) is often touted as a clear sign of gerrymandering, it is in fact merely a potential side-effect. A non-compact district is not necessarily one that isn't gerrymandered, nor is a compact one neccessarily not gerrymandered. Indeed, it doesn't really make sense to say "district x is gerrymandered", as gerrymandering neccessarily involves trading voters among multiple districts to alter statewide results. That is, it isn't districts that are gerrymandered, per se, but whole states. So we know right away that this measure fails, since it only considers a single district, when we know that you need to consider at least 2 districts. Shown below is an example of a false negative and a false positive, if one were to use compactness as a measure of gerrymandering. The color represents the partisan-ness (more blue = more dem, more red = more repub). The left isn't gerrymandered, the right is. But the compactness measure would detect precisely the opposite - it would fail to detect the gerrymander on the right side, will falsely reporting a gerrymander on the left side. 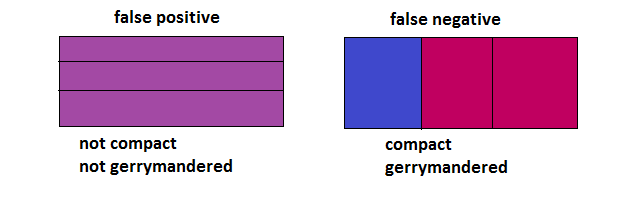 Compactness passes all the other tests, though. But not for good reason. It is independant of turnout, swing, etc., precisely because it is independent of the vote count altogether. The number of peas in a pod is fairly independent of the ambient air pressure, but that doesn't mean it's a good indication of temperature. Likewise, compactness is fairly independent of vote swings, but that doesn't mean it's a good indication of gerrymandering. Efficiency gap Because the "efficiency gap" measure falsely assumes that first-pass-the-post voting systems produce a diagonal seats-votes curve, it will inevitably produce both false negatives AND and false positives, and will always flip the sign of the detected partisan gerrymander when there's a sufficient uniform partisan swing. 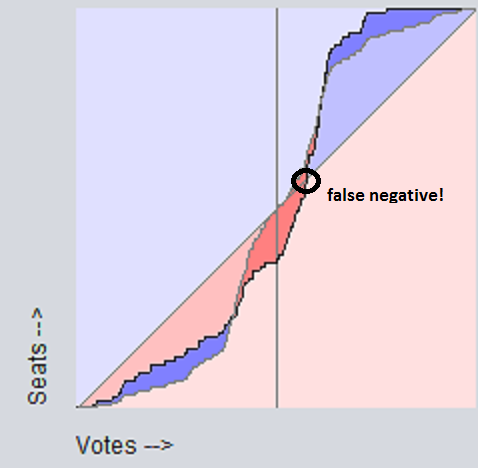 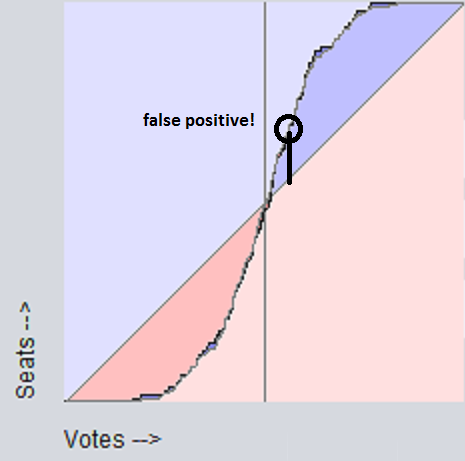 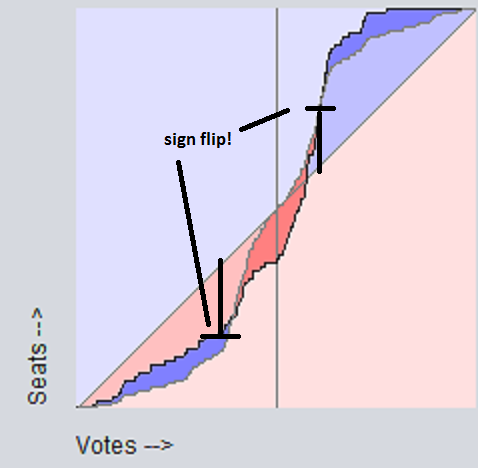 Since it fails the "changes sign on uniform partisan swing" test, we know that it also fails the stronger restrictions "independent of uniform partisan swing" and "independent of non-uniform partisan swing". Also, since as soon as an election goes from 49-51 to 51-49, that election goes from 100% wasted dem votes, 0% wasted repub votes, to 0% wasted dem votes, 100% wasted repub votes, we know that the "efficiency gap" is discontinuous, so it fails that test, too. Grofman/King asymmetryShort answer is Grofman/King asymmetry passes all tests. Best/McDonald/Wang median minus meanShort answer is Best/McDonald/Wang median minus mean passes all tests. Baas asymmetryShort answer is Baas asymmetry passes all tests. Now let's summarize this all in a table:
We see right away that the only ones that don't pass all the pass-or-fail criteria are compactness and efficiency gap. So those get ruled out right away. The remaining three all meet all of the criteria. So at this point we're left with a three way tie. Next, we'll look at how to break that tie. STEP 3: Finding the winnerThe "seats-votes" curve below displays all the relevant info about the partisan-ness of the districts in one clear graphic. The x-axis is % votes democrat, and the y-axes is the % of the seats dems would get at that vote % in the given districting scheme. Since this graphic shows all of the information, any measure of partisan gerrymandering can be displayed on it. This makes it a very useful tool for seeing how the different measures relate. Below is a seats-votes curve for the Wisconsin 2012 assembly election. (Note, each election has its own seats-votes curve, and you can average multiple elections together to get a mean statistical seats-votes curve over a multi-year span.) On it you can see four different measures:
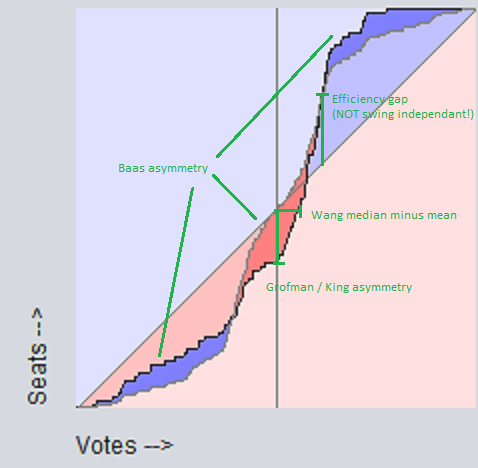 You can see right away that minimizing the Baas asymmetry will also minimize both the Grofman/King asymmetry (which is just the vertical displacement at x=0.5) and the Best/McDonald/Wang median minus mean (which is just the horizontal displacement at y=0.5). I'm thus calling it "at least as good as" these two other measures, since optimizing it also optimizes both of them. However, the reverse is not true - optimizing e.g. Grofman/King asymmetry will not fully optimize Baas asymmetry, since Grofman/King asymmetry only minimizes the displacement at x=0.5. Likewise for Best/McDonald/Wang median minus mean. We can say, also, that Grofman/King asymmetry is at least as good as Best/McDonald/Wang median minus mean, since optimizing either one is simply moving the center of the curve so that it intersects x=0.5,y=0.5. This covers all combinations, so we can now put all of these relationships in a (completed!) table:
We can conclude from this table that optimizing Grofman/King asymmetry or Best/McDonald/Wang median minus mean will also optimize the other, but optimizing Baas asymmetry is the only measure that will optimize all three. Consequently, Baas asymmetry is in an important way pre-eminent, because if we had to chooose just one measure to optimize to minimize partisan gerrymandering, it would be the only choice that optimizes all measures that meet the minimum requirements. So we come at last to our one true winner:
2016.01.24: (Blog) The Mathematics of Gerrymandering: Why is it Possible?If we want to measure gerrymandering, we must first understand how it's done. In most states, there is a single winner in each election: whoever has the most votes. This is called a "first-past-the-post" voting system, or "winner-take-all", or "single-winner plurality", more formally. And it has a major weakness. This weakness has four very undesirable consequences:
Think of the voters as a bag of jelly beans. (Nooo! Don't eat them!) Dems are blue, Repubs are red. Now an electoral district contains a subset of these jelly beans. So in our analogy here, we'd grab a handful of beans out of the bag and that represents our district. Since this is a single-winner plurality system, whatever color we have the most of is the winner. Now let's say we only pick 3 beans. Now there are 8 combinations (where r=red and b=blue): rrr,rrb,rbr,rbb,brr,brb,bbr,bbb. But we only care about how _many_ of each color there are, so we can group them accordingly:
Now the chance of getting bbb is just the chance of picking a blue the first time, times the chance of picking a blue the second time, etc. The chance of getting bbr, is the chance of picking blue the first two times, and red the second. Since the order of multiplication doesn't matter (the communitive property), this number is the same for bbr,brb,and rbb. It only matters how many reds and how many blues. So let's fill in our chart a little more - let's say there's a 60% chance of red and 40% chance of blue. Then we have:
Now red gets elected if there are at least 2 red beans. So we simply add up the probability of there being 2 red with the probability of there being 3 red, and we get 0.432+0.216=0.648. So red has a 64.8% chance of getting elected. You see what happened there? 60% of the beans were red, but that led to a 64.8% chance of picking mostly red beans. The more beans we pick the more the odds are going to amplify like that. Here is our first problem: single-winner plurality systems naturally do NOT result in proportional representation. They instead follow what's called a "cumulative normal distribution" function, which looks like this: 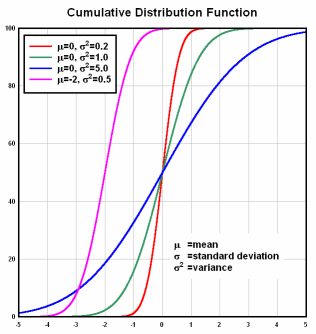 And that leads directly to our second problem: wasted votes. Once one party has a slight majority, total victory is all but guaranteed. Anything short of that, defeat is almost certain. So if you're a voter in a district where one party has a sizeable lead in the polls -- and by "sizeable" we're talking like 5% here -- it's very unlikely your vote is going to make a difference. And that's regardless of whether you'd be voting for the losing party or the winning party. Overtime people start to realize this, and people start developing the attitude: "there's no point in me voting, the outcome is already guaranteed in my district: party [x] will win." And for the most part, really, they're right. And so what you get is a drop in voter participation, that just gets worse and worse over the years. And before you know it, you have dismal voter turnout rates. Which is what we have. Compared to any other country, our voter turnout rates are dismal. And a huge part of the reason for that, is that in a first-past-the-post voting system, not turning out to vote is often a fairly rational choice -- since your vote would just be wasted. First-past-the-post voting systems lead to a high number of wasted votes, which leads to learned helplessness, which leads to complacency. Now let's throw in a third party, say green. Let's say that our bag is 45% red, 45% blue, 10% green. Let's say we picked 9 jelly beans. You see green's problem here: in order to get elected they need more green beans than either of the two other colors. We'd need at least 4 green beans in our handful. The likelihood of this is very slim. MUCH lower than 10%. Red and blue still have about a 50% chance of having a plurality, while green, still pretty much 0. The further green falls short of being tied with red and blue, the chances of it getting a plurality in our handful drops exponentially. And we've come to our third problem with single-winner plurality systems: it makes third parties practically impossible. And last, but certainly not least, how it enables gerrymandering... Recall in the first problem, red could have either 2 OR 3 jelly beans and would still win exactly 1 election. Furthermore, due to the amplifying effect - red only need win a slight majority in order to have a high likelihood of securing that election. A 60% lead translates to a 64.8% chance. And that was only from picking 3 beans. In an actual election, there are hundreds of thousands of voters -- we are picking hundreds of thousands of jelly beans -- so the effect is much more extreme. These 2 properties of single-winner plurality systems,
In conclusion, and to reiterate, it is the "first-past-the-post" or "single-winner plurality" voting system that causes a host of problems for democracy, including:
2016.01.21: (Blog) The Gold Standard of Election Fairness: Bayesian RegretThe problem of redistricting falls under the branch of mathematics known as "Decision Theory". According to Wikipedia, Decision Theory "is concerned with identifying the values, uncertainties and other issues relevant in a given decision, its rationality, and the resulting optimal decision." So what is the "optimal decision"? Well, to put it in a phrase, the optimal decision is the decision that minimizes "Bayesian Regret". What is "Bayesian Regret"?Put simply, the "Bayesian Regret" of a redistricting plan is the expected avoidable human unhappiness caused by using it. To unpack this: Let's say each citizen assigns each candidate a "utility" value. Now the best possible outcome is of course when the candidates that get elected are precisely those candidates that maximize this "utility" value, over the sum of all the citizens' ratings. But in a real voting system, that's not what's going to happen. The actual results will fall somewhat short of this ideal. The amount that the actual results fall short of this ideal maximum utility choice is called the "Bayesian Regret". If a rule increases Bayesian Regret, you know right away that it's a bad rule and you shouldn't use it. For example, so-called "communities of interest" increase Bayesian Regret, so you know right away that they're bad and you shouldn't use them.
So you see it's the apex criteria. It tells you quantitatively how bad the final outcome was compared to what voters really wanted; compared to the best possible outcome, as judged by their own assessments. Bayesian Regret is the gold standard for election fairness. From it, everything else follows. Bayesian regret is well-vetted and has been for centuries.Bayesian Regret is not a new concept. It dates back to the earliest days of statistics (1800s) and it has been used in at least a dozen papers on non-voting-related subjects. The only thing "new" here is applying this well known concept to voting methods. And that idea is not entirely new, either. It's been discussed, among other places, in papers by Samuel Merrill (Princeton University Press (1988)) and Robert Bordley (American Political Science Review, 77 (1983)). Mathematicians everywhere recognize the specialness of Bayesian Regret; There's no dispute about it -- it's king. Bayesian Regret is the mother of all Auto-Redistrict fairness rules."Bayesian Regret" is the arcstone of the program's criteria. It is THE litmus test; the Omega. Every fairness criteria available in Auto-Redistrict asymptotically decreases Bayesian Regret. None of them increase it. This guarantees that any and all optimizations done by Auto-Redistrict will increase average voter happiness. For more information...
2016.01.18 (MLK Day): (Blog) Enumerating the NuancesSo I decided to try to enumerate all the technical nuances of redistricting reform, and try to organize it into categories and a 1-dimensional ordering that flows well. Call it my natural compulsion to "systematize". A tell-tale trait of a software developer. The list was longer than I anticipated. But I think from it you can get a good sense of the issues. And a good sense of the great value of systemizing. It allows you to identify how the different issues relate, so that you can solve them one at a time in a way that guarantees eventually solving the whole thing. And you can identify where the critical points are. The "pivot points", or "centers of gravity", to borrow a phrase from Clausewitz. See if you can find them. Anyways, without further ado... forgive the lack of explanation for the items, it's meant to be an organized list - a map. As such it more resembles notes or a table of contents than anything else: PART I: THE PROBLEM category: the two types of gerrymandering: choosing the voters, and choosing the candidates. * vote packing ** partisan - reducing competitiveness of districts that favor a party ** racial - reducing competitiveness of districts where certain racial demographics are ** "communities of interest" - like racial vote-packing, but can be used for any voting group. * candidate packing ** hijacking - forcing candidates to run against each other or not run against each other ** kidnapping - forcing a candidate to a place where they'd lose or win ** "communities of interest" - choosing a candidate by packing the voters together. category: other effects of gerrymandering (besides controlling legislation): * gerrymandering also reduces voter turnout, since people realize their vote doesn't count. ** this effect tends to exacerbate the partisan advantage gained by gerrymandering category: how is gerrymandering possible? * single-winner system enables gerrymandering since a 49-51 vote has the same result as a 1-99 vote, votes can be shifted around to control the number of a certain result * single-winner system forces two-party system (since likelihood of getting elected drops exponentially with %vote) * congress, votes party line thus, all that matters is which party has the majority that determines what bills get passed and what bills don't * since congress votes party lines, and can gerrymander, map drawers can control what legislation gets passed by gerrymandering (by partisan and racial vote packing) FOR THE NEXT 10 YEARS! * multi-member solves both problems ( FairVote.org ) ** prevents gerrymandering because now a 49-51 vote doesn't have the same result as a 1-99 vote, *** note it also makes candiate packing far less effective (since a candidate will automatically have more competitors and a larger voter base) ** allows 3 or 4 party system since now a candidate only needs 10% of the vote (1/2 of 1/5th) AND that % is drawn from a larger voter base. (since the district is bigger) *** enabling a third party reduces effectiveness of party-line voting. category: descriptive vs representattive, and the real impact of "communities of interest" descriptive remedies: ** communities of interest ** VRA *** loved by the gop - because it helps them (by vote-packing dems) ** congress, votes party line, so the only thing that matters is which party gets the majority. vote packing, regardless of what you call it (communities of interest, etc.), reduces the representation those voters prefered party gets in congress. thus reducing the likilihood that their prefered policies get enacted. in other words, "communities of interest" always _disfavors_ those communities' political interests. ** communities of intereest and VRA "descriptive" interpretation give legal blank check to gerrymander. to quote Christopher Ingraham from the Washington Post: It's a point well-taken. But "community of interest" is an incredibly squishy term. You can define it pretty much however you want. As I wrote in 2014, if you're a politician in search of a figleaf justification for putting voters from disparate corners of the state into the same congressional district, you can always find one. Communities of interest are a great ideal, but in practice they're so fuzzy that they open the door to all manner of redistricting shenanigans, as we've seen.
PART II: THE SOLUTION

category: "Is there an identifiable goal that can be stated in language the average voter will understand?":
* role of competiveness / voting power
* restating as a communication problem: the goal is to maximize bandwidth.
** restating it that way gives you a very definite solution:
** maximize entropy of the composition of congress
** maximize mutual information between composition of congress and the votes of the citizen.
* this transaltes to:
** maximize overall competitevness of elections (= maximum entropy)
** make each person's vote count the same (due to the gibbs inequality)
*** making each person's vote count the same means making each voting group's elections be equally competitive
* this can be restated as preventing vote packing.
** how to measure and prevent vote packing:
*** maximal competitiveness
*** racial equality
*** partisan equality
** obstacles to preventing vote packing:
*** current software lacks analysis of vote packing (excepting auto-redistrict)
*** the compactness rule disfavors clustered demographics - tends to vote-pack them.
*** the are no laws against it, in fact there are laws FOR it!!:
**** the descriptive interpretation of the VRA legitimizes racial vote-packing.
**** "communities of interest" legitimizes vote-packing across the board
***** and tricks those communities into thinking it's good for them.


category: geometric approach doesn't work
* compactness is a common _symptom_ of gerrymandering, but...
** but compactness doesn't neccessarily imply the absence of gerrymandering,
** nor does non-compactness imply the presence of gerrymandering.
* compactness rule (and minimal splits rule) is biased against clustered demographcis
** most notably dems
** and minorities
* can be counteracted by fairness rules


category: fairness rules, how to do them
* first you need the election data, at voting tabulation district resolution. (the highest that's available)
* use only the _empirical_ data; the actual vote counts
* remember to "impute" the uncontested elections (see page 27 & 28 of "PARTISAN GERRYMANDERING AND THE EFFICIENCY GAP")
* all rules must increase the bandwidth (amount of information communicated) from voters to composition of congress.
* rule 1: maximize overall competiveness - this means that more information will be transfereed to the result
** particularly you minimize the sum total of the victory margins
* rule 2: minimize racial/demographic vote packing (per gibbs inequality)
** particularly you do a by-district weighted sum of # of wasted votes, weighted by % population,
    divide that by # of total votes, weighted by % population.  That's your wasted vote rate.
    to get how unequal it is among demographics, you:
    1. normalize it to 1 by dividing by the average wasted vote rate
    2. take the statistical variance of that among different ethnicities.
    the rule should be to _minimize_ this variance.
* rule 3: minimize partisan vote packing (per gibbs inequality)
** single winner elections: maximize seats-votes curve symmetry (total displacement from symmetry)
** multi winner elections: maximize seats-votes curve diagonalness (total displacement from diagonal)


category: need for transparency and citizen vigiliance-
* GIGO (garbage in, garbage out) - programs can be tricked, etc., by feeding it false data.
   deception can bypass everything.  (sun tzu: "war is all about deception")
** data must be public and geocoded in simple format, like GIS format. Wisconsin GAB is a great example.
** public must have free and open source tools for analyzing the data, and the math and computer skills to do it.
* code must be open-source
** _and_ people must actually review that code.
*** means you need good compsci, math, and logic public education.
** also must be open-documentation; methodology must be documented and that documentation public.


category: a few different models, and their shortcomings:
* the california model - lacks any rules.  you fix gerrymandering by controling the rules, not the people.
al it does is remove the fence from the henhouse, which doesnt prevent the fox from getting in.
* ohio model - nice that it's rule-based, but disfavors demographics that cluster.
* independant commision - prolly better, but like california model, it's still anarchy.  need to define the rules.


category: on legislation (putting it all together):
* need to see the data (some legislation prohibits its use)
* some legislation neglects that districts can't be drawn in isolation - moving a line moves two bordies,
and moves people to one district as much as it takes from the other.
* some proposed legislation contradicts itself, e.g.:
   "cant be drawn to favor or disfavor a party",
   yet allows for drawing communities of interest,
   which disfavor that community's prefered party.
* legislation really needs to be rule-based, deciding the people doesn't make as much of a difference.
** rule category: objective rules about the statistical consequences of the map
*** example rule: outlaw vote-packing (both partisan and racial), as determined _empirically_, compared to less packed maps.
*** example rule: maximize overall competitiveness
** rule category: transparency
*** example rule: publicly publish election data at tabulation district level gis file, along w/census and demographics.
*** example rule: publicly publish statistics on how much vote packing the maps do, by party and by race.
** rule category: election system / voting method
*** example rule: multi-member districts


PART III: other types of voting rights abridgment.

category: sly tricks that have the impact of gerrymandering (abridging voting rights);
(disproprtionally inconveniencing voters)
* id's (..and then closing dmv's in certain areas)
* lack of a voting holiday (disproportionally effects low-income voters)
* driving distance
* insufficient voting equipment, staff, etc. in certain areas
* early voting
* poll hours
2016.01.13: (Blog) On Racial Vote Packing and the Voting Rights ActDistrict lines sometimes minimize the influence of minority voters by disproportionately consolidating them within single districts. This is called vote packing. Packing minority votes together abridges their right to vote. It makes their votes count less. The Voting Rights Act (VRA) expressly prohibits abridging minority rights to vote under color of law. Ironically, people have tried to use the VRA to justify racial vote packing. They abridge minority voting rights under color of precisely that law that says you shouldn't abridge minority voting rights under color of law. In fact, vote packing doubly disenfranchises. Firstly because it reduces the impact of the person's vote by putting them in a district where the outcome is already predetermined. But secondly, because it spreads that group of voters out among fewer districts, thus reducing the number of representatives they have representing them. It diminshes not only their ability to make their voice heard at the voting booth, but also their ability to make their voice heard when congress votes. Packing a voting group's votes always disfavors their preferred political party, potentially preventing them from getting a majority in congress, when they otherwise would. And in the highly polarized political climate that we are in, where nearly every vote is "down the aisle", that determines everything. I ran the numbers for the Wisconsin 2012 assembly elections, and in those elections, black voters' votes counted a little less than half as much as everyone else's. More precisely, they had twice the rate of wasted votes per vote than the average voter. It's not an exact linear relationship there - to go from that to saying their votes count half as much. Arguably it's actually worse than that because as elections get less competitive they get exponentially harder to flip. And as it turns out, more than half of the votes they cast were votes that were not needed to win the election - that is, more than half of their votes were wasted. In contrast, white voters had less than a quarter of their votes wasted. This disparity is, of course, obscene. It's reminiscent of the days before the civil war, when blacks were only counted as three-fifths of a person. And this is the kind of thing that people have been trying to use the VRA to justify.
How much a vote counts is determined precisely by how competitive the election is. Each person's vote should count about the same, regardless of their ethnicity. The principle of "one person, one vote" requires therefore that no ethnicity is packed into disproportionately uncompetitive elections. The voting rights of minorities shall not be abridged. 2016.01.07: Fixing Wisconsin's Heavily Gerrymandered DistrictsWisconsin Public RadioResearch shows that Wisconsin is among the most gerrymandered states in the country. Both Democrats and Republicans are guilty of redrawing lines to their own political advantage. Our guests will talk about a pending lawsuit that challenges the redistricting process and highlight some possible solutions. 2016.01.07: Can New Approach End Gerrymandering?by Bruce ThompsonThe challenge to Wisconsin’s partisan legislative districts recently survived its first hurdle. A three-judge federal panel rejected motions from Wisconsin Attorney General Brad Schimel to throw out the lawsuit on several grounds, including lack of standing on the part of the plaintiffs and the assertion that the US Supreme Court has already rejected their claims. While the decision itself was largely about process, the three federal judges proved remarkably clear eyed. Schimel argued that Democrats fared poorly because they cluster in cities:
Democratic supporters are concentrated in specific locations such that they naturally are “packed” into districts drawn using ordinary districting principles. The judges did not buy this argument, instead describing how Republicans set out to gerrymander the legislative districts.... Read the full article at UrbanMilwaukee.com 2015.12.28: (Blog) The Three Ways to Redistrict, and their ResultsWhile every state has their own minor variations in redistricting procedure, they all fall into one of three basic categories:
Anarchy (not rule-based) -- In this procedure, no rules are enforced except for the constitutionally mandated equal population. I was going to say that contiguity was also a rule enforced here -- that districts aren't broken up into pieces -- but Maryland serves as a rather egregious counter-example to that. So, only equal population. Basically the people drawing the maps can draw them however they like. If you don't like the map, the only recourse you have is through the court system, and that'll cost the taxpayers literally millions of dollars (they pay for both plaintiff and defendant). Historicaly, most such challenges have failed. Naive (rule-based, no data) -- In this procedure, rules are used to construct a map, and the rules pretty much uniquely determine the map. So this eliminates the possibility of deliberate human manipulation, except insofar as the choice of rules is deliberate and done by humans. However, no data about voting is used, only geometric data (compactness, county splits, and contiguity), so the method is essentially blind. It is tempting to say that it perfoms as good as randomly picking a map out of a hat, but that would be incorrect. Rules of compactnes, fewest county splits, and contiguity, are neither random nor neutral. Depending on the political geography, these rules may either result in a more fair or less fair map than a random map. To find out which, we'd have to use the voting data. But this method expressly prohibits use of the voting data. Informed (rule-based, data) -- In this procedure, rules are used to construct a map, and the rules pretty much uniquely determine the map. So this eliminates the possibility of deliberate human manipulation, except insofar as the choice of rules is deliberate and done by humans. However, unlike the naive approach, election data is used to satisfy rules about competitiveness, partisan symmetry, and racial equality. This approach is thus guaranteed to score better in those categories than the two other approaches. So how often is each method used? Well, surprisingly enough, 49 out of 50 states use the anarchy method. The one exception is Iowa, which uses the naive method. Not a single state uses the informed method. Now let's take a look at the results of each method. Below is a comparison of the results of each method, used to redistrict the Wisconsin Assembly, using (or not using, as the case may be) 2012 election data. The results of the anarchy method, used by 49 out of 50 states, are, as one might expect, horrendous. The naive method is considerably better, but it turns out much worse than a random map on partisan symmetry, competitiveness, and racial equality. Of the three approaches, the informed approach is, unsurprisingly, the best, and by no small measure.
Population imbalance % is calculated as the population of the highest population district, divided by that of the lowest population district, times 100. Compactness is calculated as the isoperimetric quotient - area divided by perimeter squared, times 4 pi. Borders on state edges were counted half as much, since they can't be moved. Partisan asymmetry is the total deviation of the seats-votes curve from symmetry. Symmetry being where if party A gets y% of the seats when they get x% of the votes, party B should also get y% of the seats when they get x% of the votes. The seats-votes curve is computed by applying a uniform partisan swing from 0% to 100% at 0.25% intervals. The deviation from symmetry is added up over all vote %'s from 0 to 100. The result ranges from 0 to 1, with 0 being perfect symmetry, and 1 being one party always getting all of the seats. Competitiveness (victory margin) is the sum total of the victory margin (votes won by) over all districts. Racial vote dilution is calculated as the variance of the victory margin per vote, among the different ethnicities. For example, If district A has a vote gap of 10,000, 50,000 total votes, and 20% are ethnicity 1, then 10,000*0.2 is added to their total vote gap, and 50,000*0.2 is added to their total vote count. If district B has a vote gap of 20,000, 60,000 total votes, and 10% are ethnicity 1, then 20,000*0.1 is added to their total vote gap, and 60,000*0.1 is added to their total vote count. All districts are totaled this way for every ethnicity. Then their total vote gap is divided by their total vote count. The statistical variance of this figure about the population mean represents the amount of racial vote dilution; the amount that some races votes are diluted more than others. 2015.12.26: (Blog) My recommended changes to Wisconsin Assembly Bill 328My good friend and representative, Jonathan Brostoff, forwarded me a link to a redistricting Bill ( https://docs.legis.wisconsin.gov/2015/proposals/ab328) that they are pushing for in the Wisconsin Assembly. Having read through that, I have objections to some of the items. I know the intentions are good, but there are some problems in the bill that I believe stem from some common misconceptions about how the math of redistricting and voting theory works out. So I sent him a list of recommended changes to the bill to remedy these unintentional issues. I decided to post those recommendations here, since I think these misconceptions are common across the country, and it would be good to clear them up publicly, for the benefit of both legislatures and voting citizens. Recommended amendments to Bill 328 (related to legislative and congressional redistricting):The current bill, due to its false assumption that political geography is inherently neutral, would un-intentially make into law systemic partisan gerrymandering. For a detailed analysis demonstrating the alleged effect, refer to the paper by Jowei Chen and Jonathan Rodden, "Unintentional Gerrymandering: Political Geography and Electoral Bias in Legislatures", available at: http://www-personal.umich.edu/~jowei/florida.pdf Below are a number of recommended amendments ( 3 additions, 2 modifications, and 1 deletion) to remedy this situation. Rule additions:
Rule modifications:
Rule deletions:
EDIT: To demonstrate the results of these amendments, I went ahead and used auto-redistrict to construct a map based on the original bill, and a map based on said bill amended as proposed. Below are the results. One caveat, though: the "Bill 328 original" map used iso-perimetric quotient instead of the original proposed measure of compactness. The actual compactness score of Bill 328 original would be worse than shown. Notice a dramatic improvement in partisan symmetry, and nearly 100,000 fewer disenfranchised voters.
I should add, then, another suggested rule to improve VRA compliance:
2015.12.10: Can Auto Redistricting End Gerrymandering?by Laura ThompsonCan gerrymandered by biased humans by replaced by the objective commands of the computer? Kevin Baas, a City of Milwaukee programmer, believes it’s possible, and has devised an intriguing solution he has already submitted to the Florida legislature to solve a dispute over redistricting. The problem he sought to solve is suggested by results of the 2012 Wisconsin state assembly elections: Democratic candidates received 53.5 percent of the statewide vote and yet won only 39 percent of the seats. This came in the wake of the 2011 redistricting effort, which was undertaken by members of the GOP-controlled legislature. Opponents have called this one of the most gerrymandered states in the U.S. and have argued that Republican legislators used the redistricting process as a chance to enhance their majority — both by “packing” Democratic voters into fewer districts, and also by “cracking” remaining Democratic areas into small pockets of Republican-dominated districts... Read the full article at UrbanMilwaukee.com 2015.09.03: First Official Release of Auto-RedistrictAuto-Redistrict is ready for public consumption! The latest stable release can be downloaded from github at https://github.com/happyjack27/autoredistrict/releases . I get asked on occasion what the intended audience is. The answer is everyone. Ordinary citizens (e.g. you), lawyers, congresspeople, independant commissions, reporters, etc... The more people to review how districts are drawn to make sure they're fair, the better. As they say in the coding world, "given enough eyeballs, all bugs are shallow".  The release contains a plethora of features, and has been thoroughly tested on a variety of states and elections. Remember, Auto-Redistrict is free and open-source. So use and redistribute as you please. Any questions or concerns about the software or how it works, don't hesitate to contact me by email at happyjack27 [at] gmail [dot] com. You can also just peruse the actual source code, published online at https://github.com/happyjack27/autoredistrict. A snapshot of the source code is included in every release. If you want to contribute to the project, just fork it and send me a merge request. (Fair warning: I will review all of your code thoroughly!) |