This page was generated on 2016.07.12 by Auto-Redistrict.
vtd_data.txt (tab-delimited)
vtd_data.dbf (dbase/ESRI)

Beaver County
Juab County
Salt Lake County
Utah County
VTD district assignments
vtd_data.txt (tab-delimited)
vtd_data.dbf (dbase/ESRI)
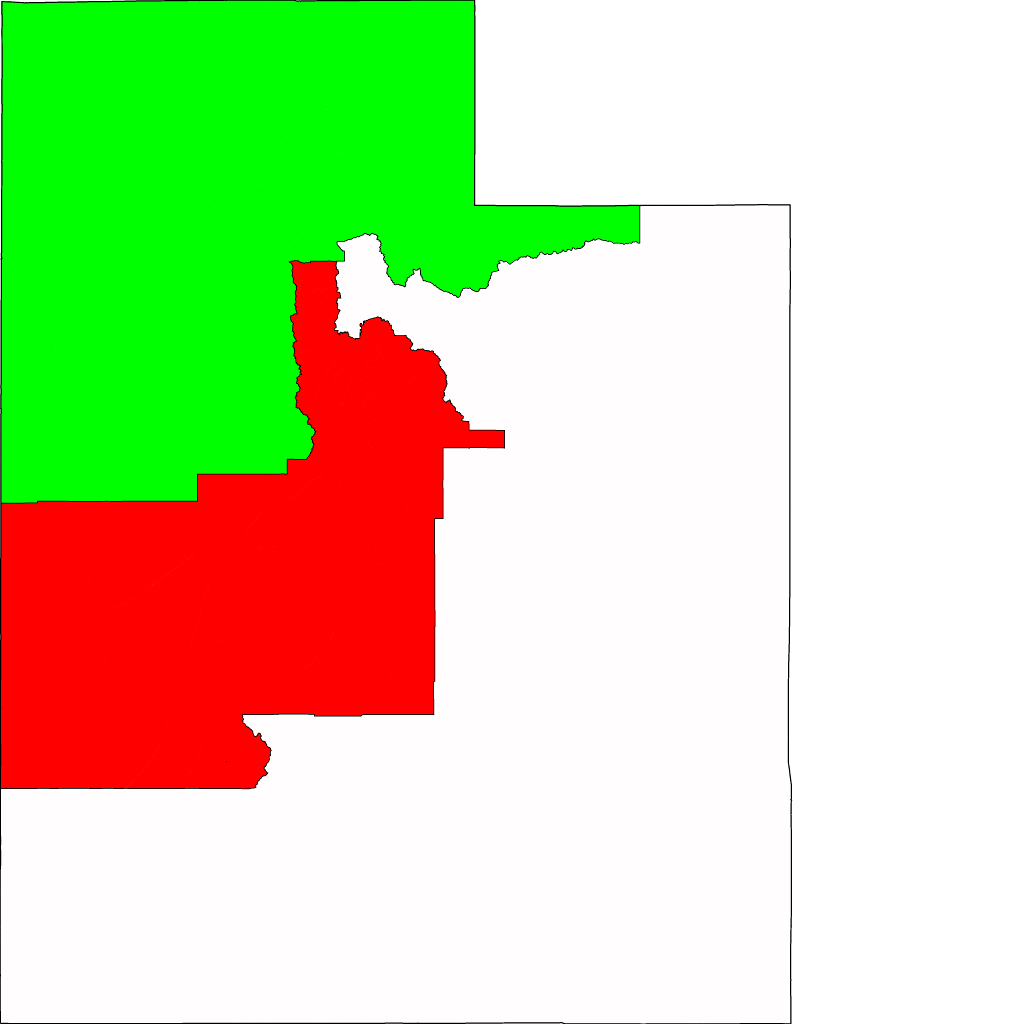
Maps (click to enlarge)
| Districts | 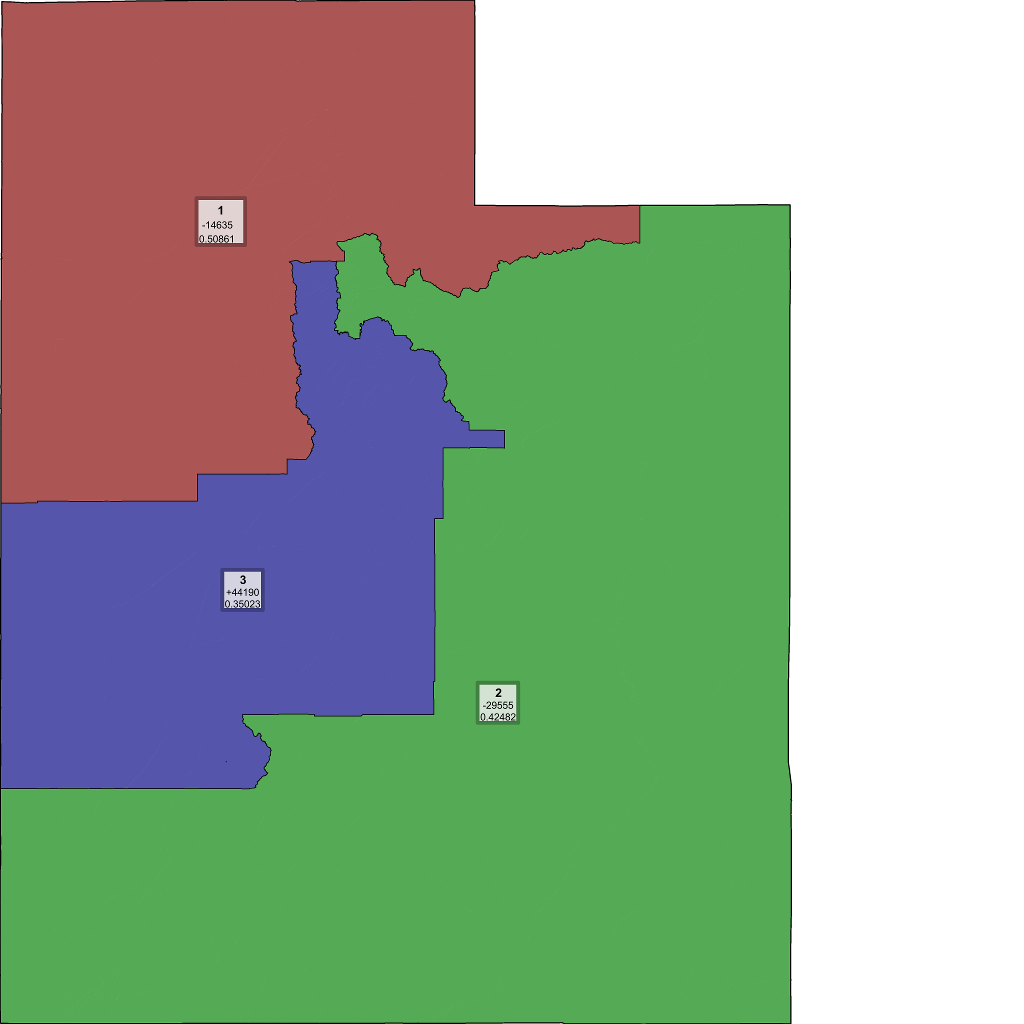 Labeled districts Labeled districts |
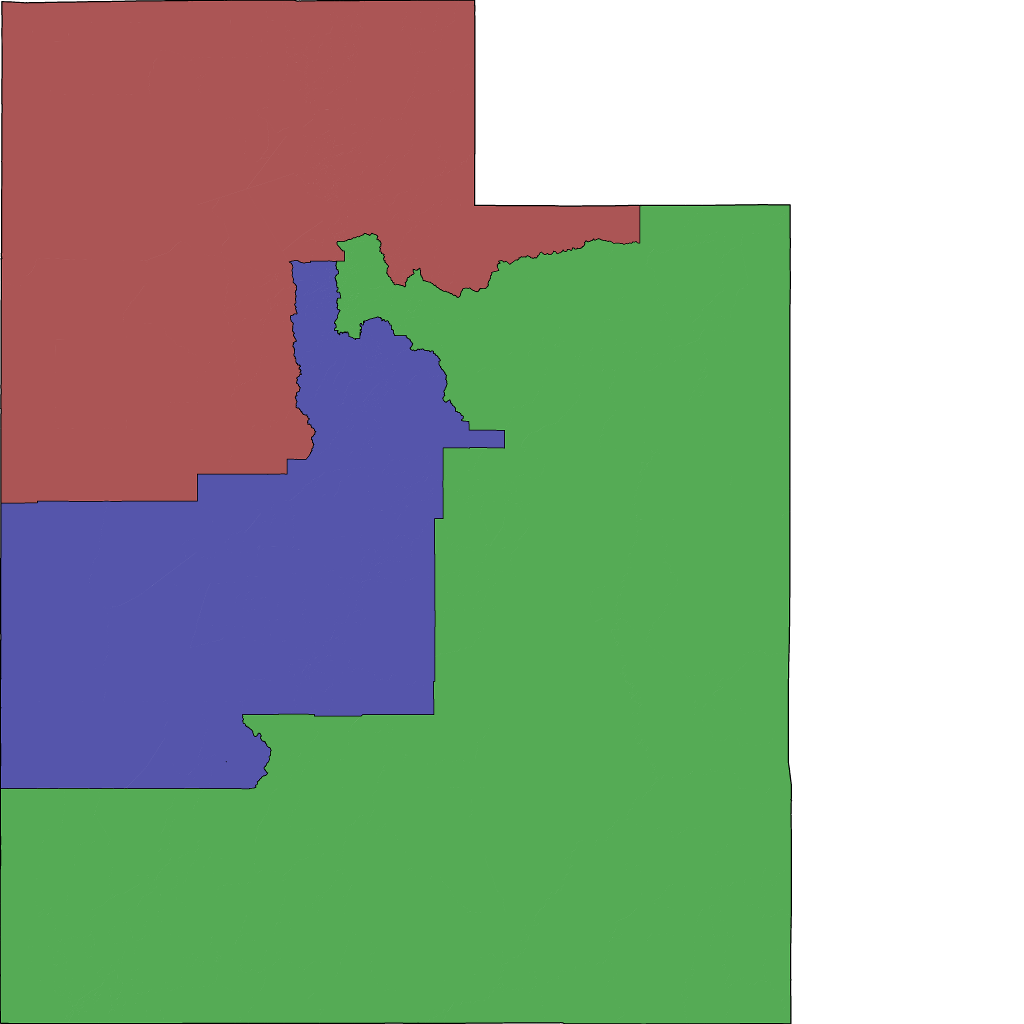 Unlabeled districts Unlabeled districts |
||
| Geometry | 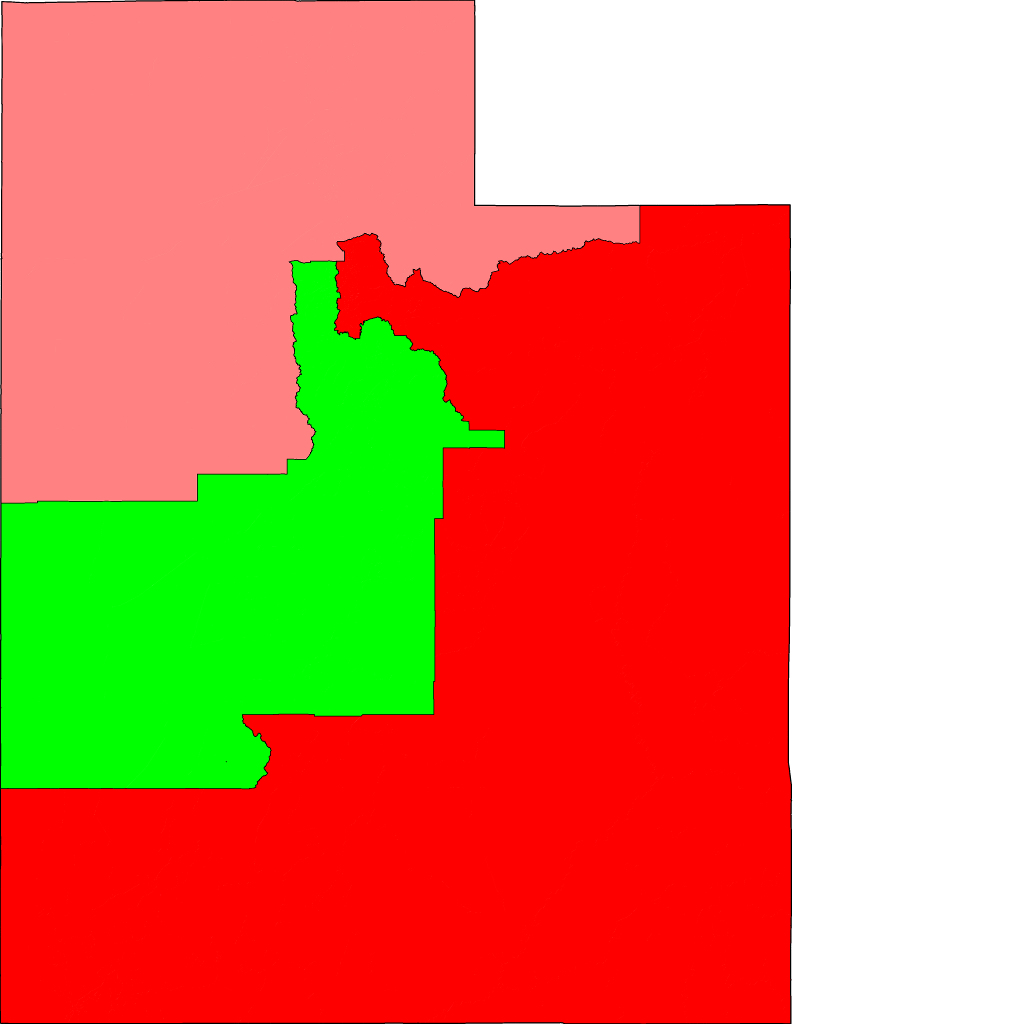 Population difference Population difference |
 Compactness Compactness |
 Splits Splits |
|
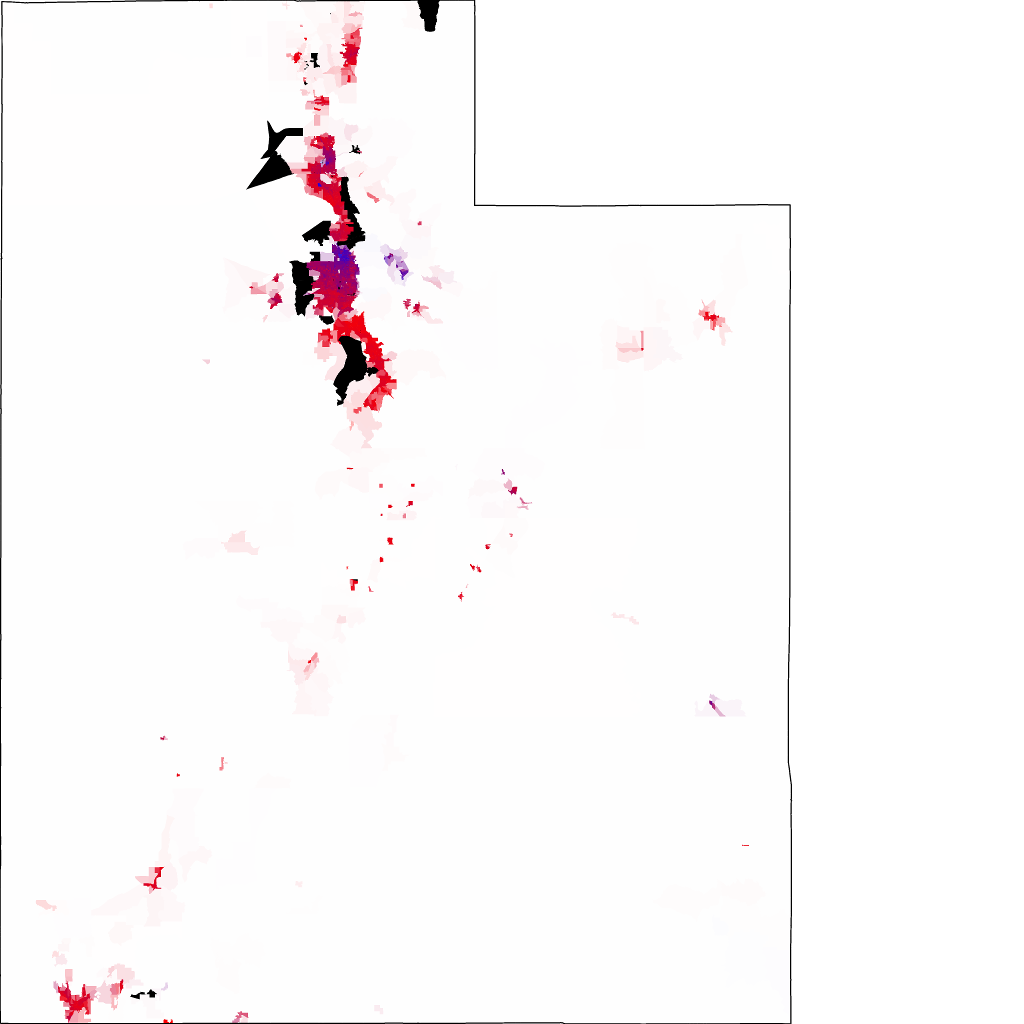
| Fairness - by district | 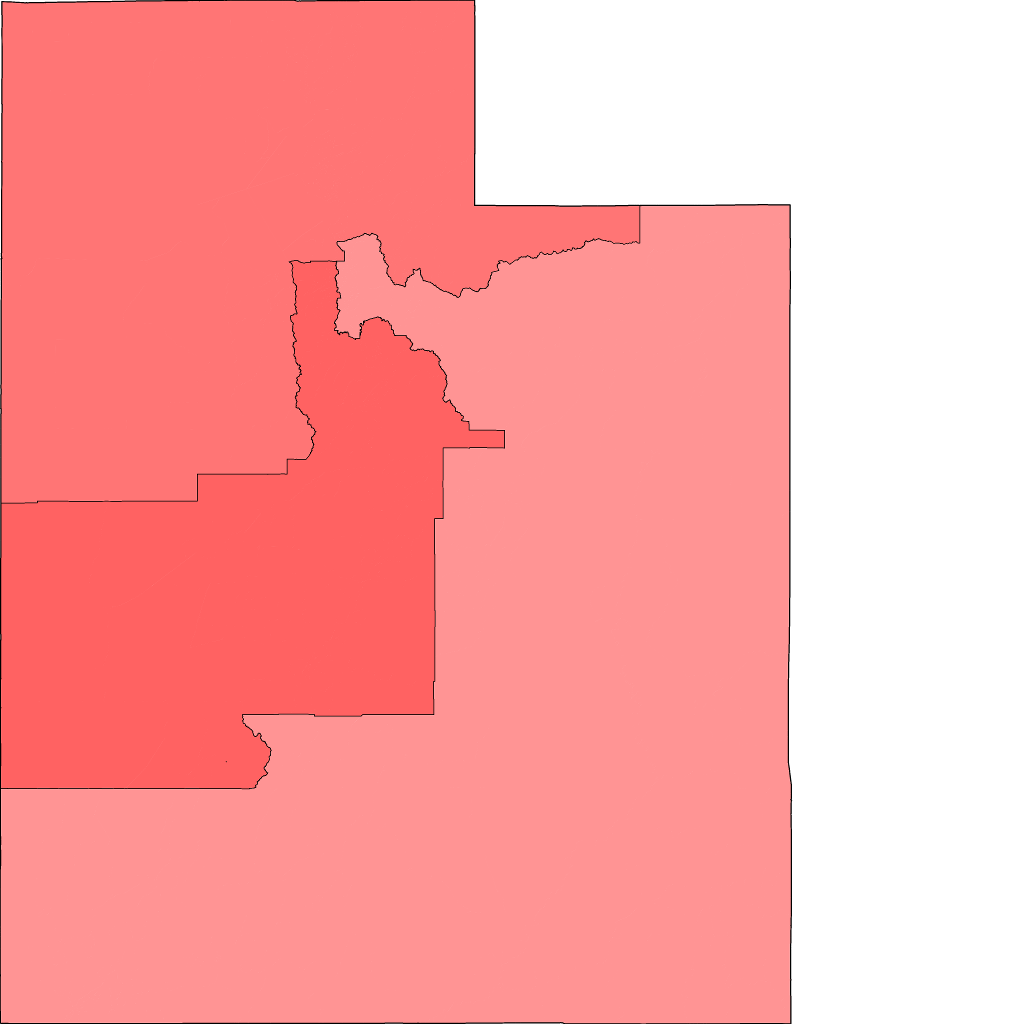 Partisan vote packing Partisan vote packing |
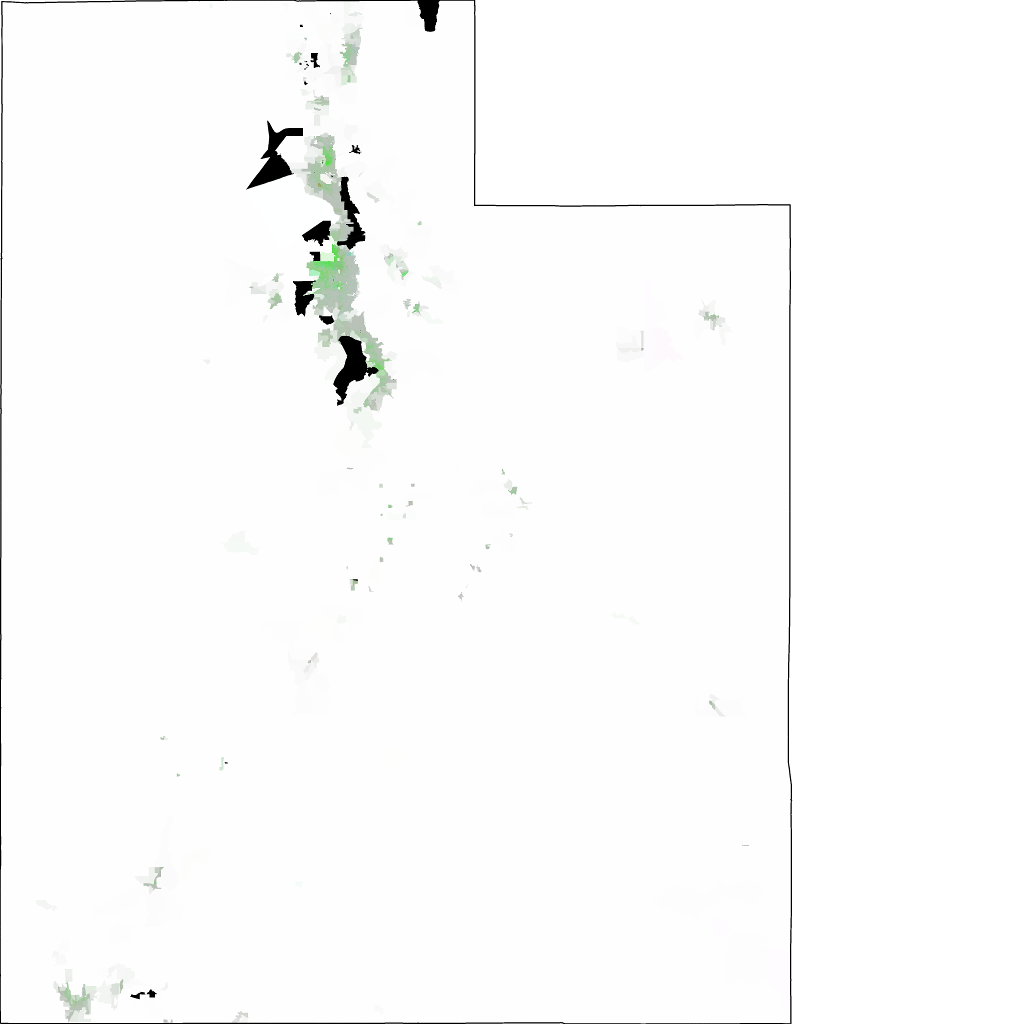
 Racial vote packing Racial vote packing |
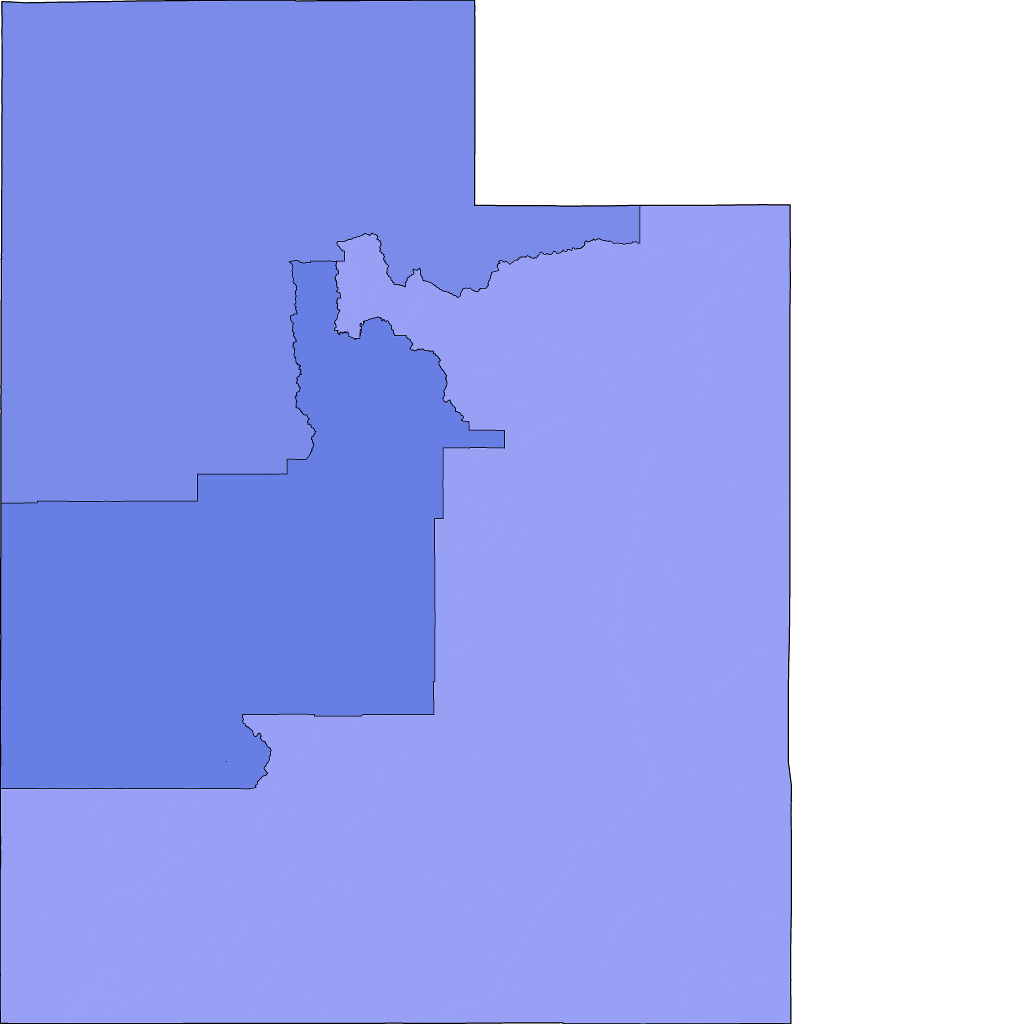
 District vote balance District vote balance |
 District demographics District demographics |
Fairness - by density |  Partisan vote packing Partisan vote packing |
 Racial vote packing Racial vote packing |
 District vote balance District vote balance |
 District demographics District demographics |
| VTDs | 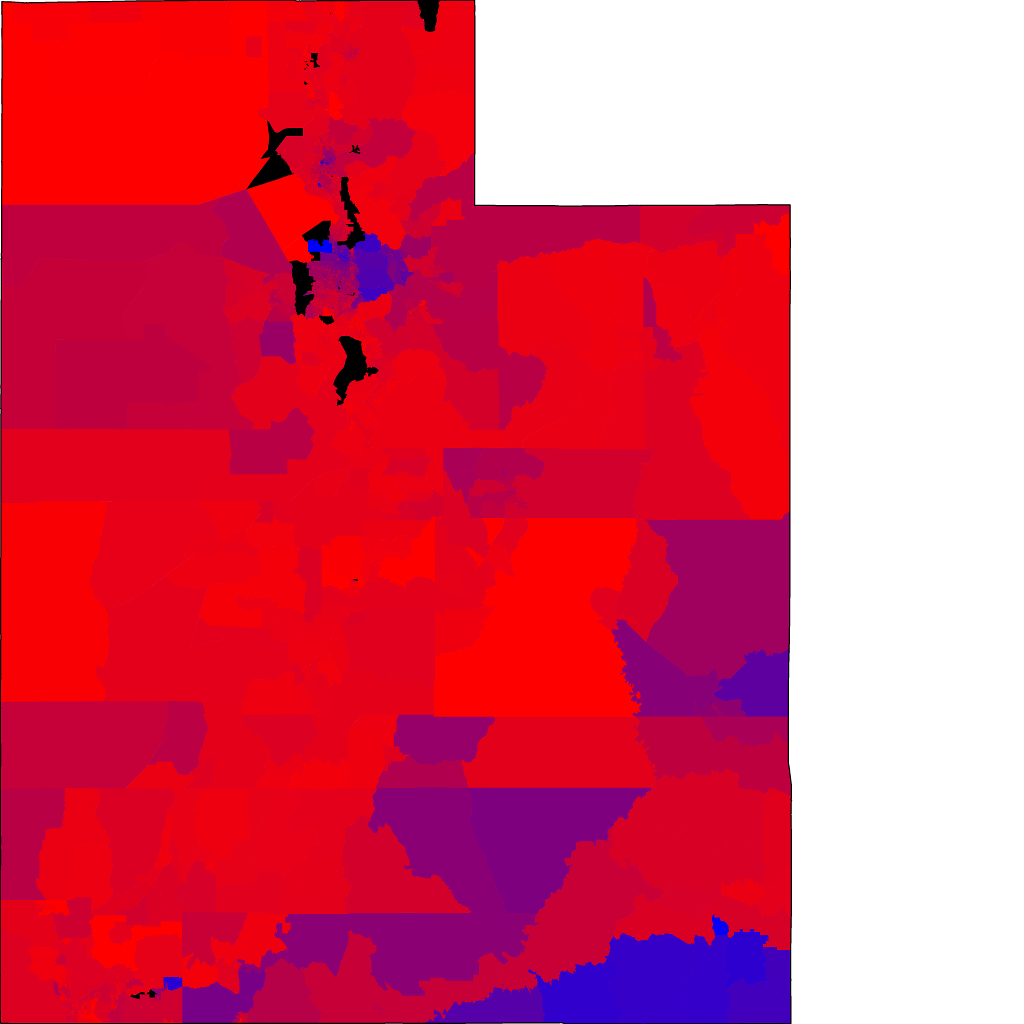 VTD vote balance VTD vote balance |
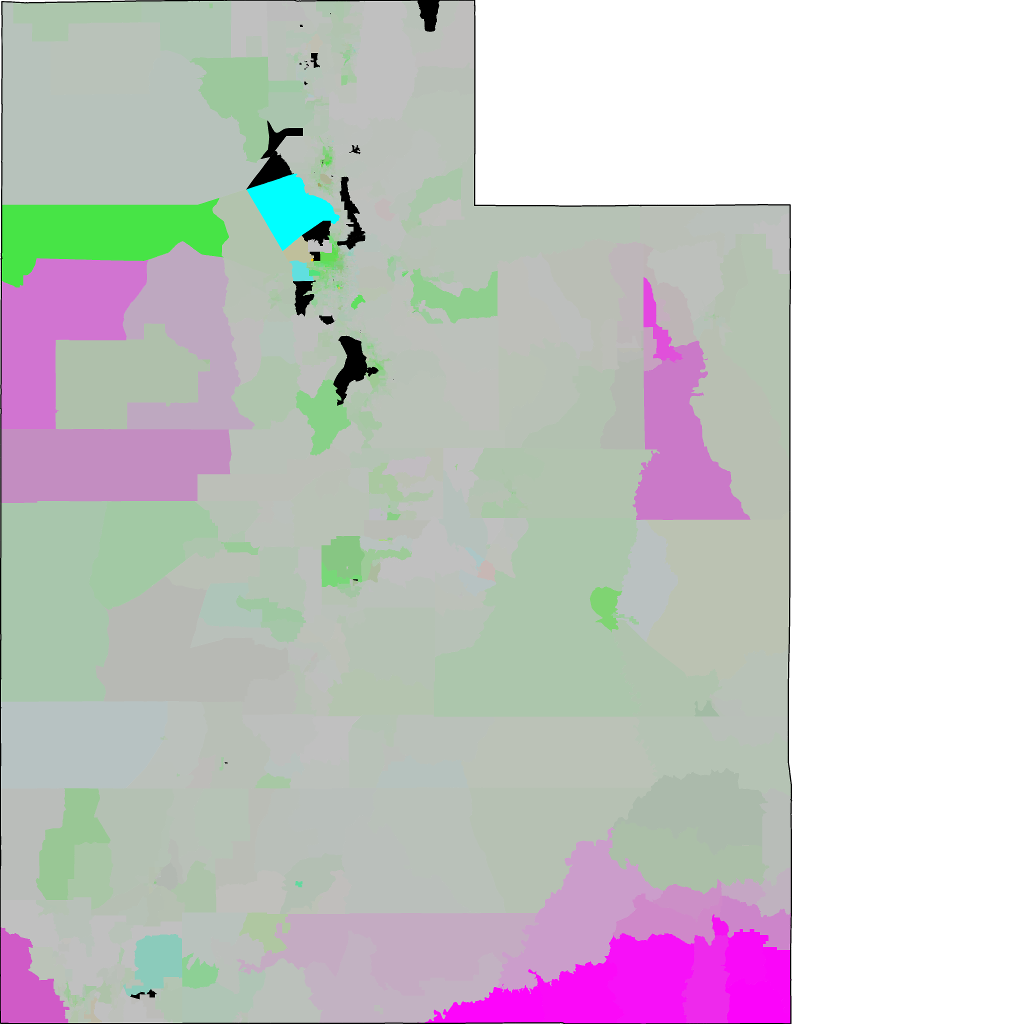 VTD demographics VTD demographics |
 VTD vote balance VTD vote balance(density) |
 VTD demographics VTD demographics(density) |
Seats / votes curve - Vote packing
Summary
| Value | Measure |
|---|---|
| 0.4180968547231759 | Compactness (isoperimetric quotient) |
| 0 | Disconnected population (count) |
| 8.269787158 | Population max deviation (%) |
| 3.197672841 | Population mean deviation (%) |
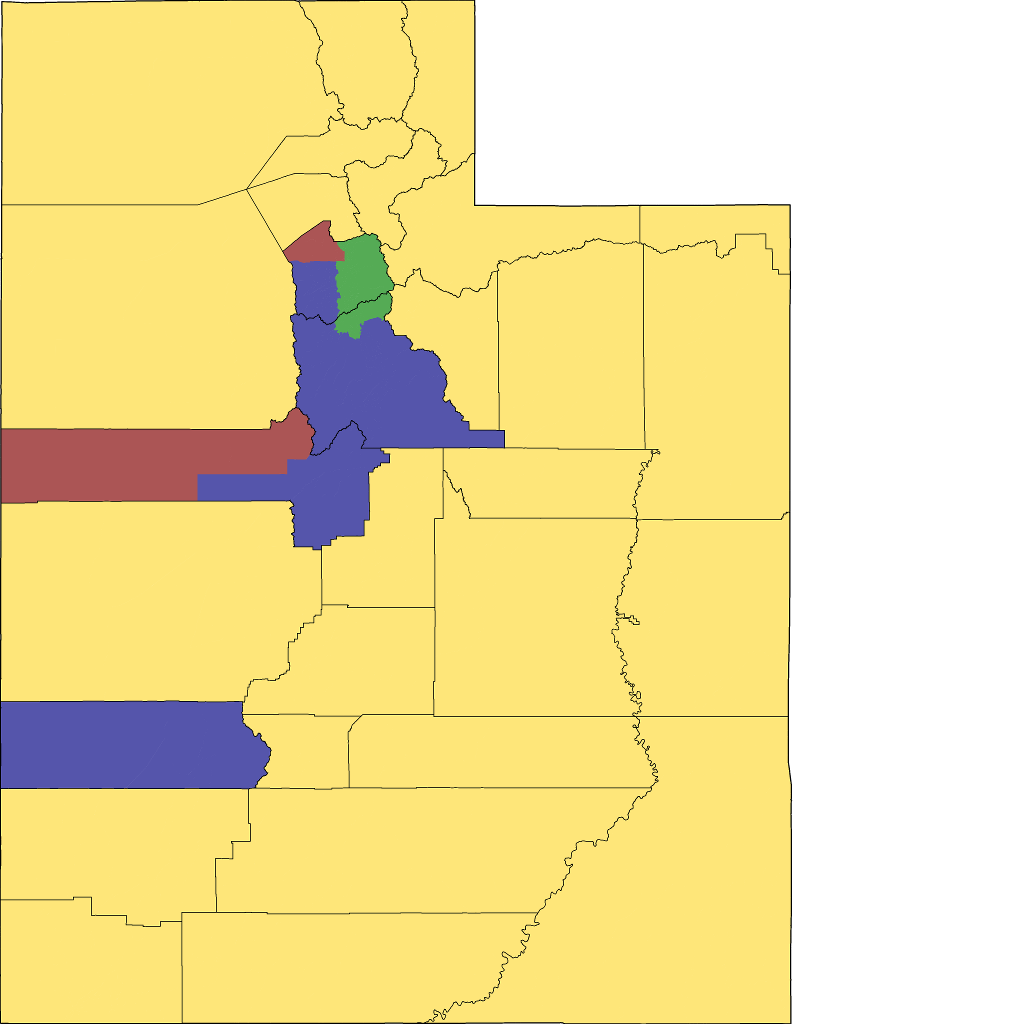
| 5 | County splits |
| 0.007065669 | Seats / vote asymmetry |
| 1,459.573691299 | Packing/cracking asymmetry (%) |
| 528,606 | Competitiveness (victory margin) |
| 0.204675810 | Disproporionality |
| 0.009978578 | Racial vote dilution |
| 2.282460551 | Efficiency gap (pct) |
| 0.068473817 | Adj. efficiency gap (seats) |
| 0 | Undescribed voters |
| 0.0 | FV Safe D |
| 0.0 | FV Lean D |
| 0.0 | FV Tossup |
| 0.0 | FV Lean R |
| 3.0 | FV Safe R |
| 0.673794700 | Mutation rate (%) |
| 33.000000000 | Elitism (%) |
| 0 | Generation (count) |
By party
| Party | Delegates | Pop. vote | Wasted votes | % del | % pop vote |
|---|---|---|---|---|---|
| PRES12_D50 | 0 | 241,226 | 241226 | 0.0 | 0.2385876972438772 |
| PRES12_R50 | 3 | 769,832 | 264304 | 1.0 | 0.7614123027561228 |
By district
| District | Population | Winner | PVI | Vote gap | Wasted votes | FV Safe D | FV Lean D | FV Tossup | FV Lean R | FV Safe R | Pop per seats | Compactness | Area | Paired edge length | Unpaired edge length | PRES12_D50 vote % | PRES12_R50 vote % | PRES12_D50 votes | PRES12_R50 votes | VAP_WHITE % | VAP_BLACK % | VAP_HISPAN % | VAP_ASIAN % | VAP_HAWAII % | VAP_INDIAN % | VAP_MULTI % | VAP_OTHER % | VAP_WHITE pop | VAP_BLACK pop | VAP_HISPAN pop | VAP_ASIAN pop | VAP_HAWAII pop | VAP_INDIAN pop | VAP_MULTI pop | VAP_OTHER pop |
|---|---|---|---|---|---|---|---|---|---|---|---|---|---|---|---|---|---|---|---|---|---|---|---|---|---|---|---|---|---|---|---|---|---|---|---|
| 1 | 906,660 | 0,1, | R+27 | 176337 | 162578 | 0.0 | 0.0 | 0.0 | 0.0 | 1.0 | 906,660 | 0.5086051073355166 | 4.802350213685575E12 | 5960993.182920856 | 6575807.895670811 | 0.22884162937675878 | 0.7711583706232412 | 74,409 | 250,746 | 0.821250018 | 0.011869144 | 0.122790598 | 0.019472637 | 0.006381503 | 0.006076006 | 0.011111057 | 0.001049036 | 508,077 | 7,343 | 75,966 | 12,047 | 3,948 | 3,759 | 6,874 | 649 |
| 2 | 891,740 | 0,1, | R+21 | 155178 | 183859 | 0.0 | 0.0 | 0.0 | 0.0 | 1.0 | 891,740 | 0.4248214340838331 | 9.524736160274834E12 | 9471294.495642861 | 9751960.50359093 | 0.28899863482342447 | 0.7110013651765755 | 106,270 | 261,448 | 0.860384832 | 0.007378684 | 0.075548399 | 0.022640255 | 0.004329836 | 0.017383947 | 0.011120810 | 0.001213237 | 546,057 | 4,683 | 47,948 | 14,369 | 2,748 | 11,033 | 7,058 | 770 |
| 3 | 965,485 | 0,1, | R+31 | 197091 | 159093 | 0.0 | 0.0 | 0.0 | 0.0 | 1.0 | 965,485 | 0.35022850033375663 | 3.43116206493764E12 | 1.0049095500554249E7 | 1395305.7348667956 | 0.190288668541886 | 0.809711331458114 | 60,547 | 257,638 | 0.796576856 | 0.006850354 | 0.141635485 | 0.023989530 | 0.012545170 | 0.005701071 | 0.011345850 | 0.001355685 | 509,434 | 4,381 | 90,580 | 15,342 | 8,023 | 3,646 | 7,256 | 867 |
By ethnicity
| Ethnicity | Population | Vote dilution | % Wasted votes | Victory margins | Votes | Straight vote descr. rep. | Target seats | Votes for next seat |
|---|---|---|---|---|---|---|---|---|
| VAP_WHITE | 1,563,568 | 0.994950734 | 0.520184725 | 435,327.691051467 | 836,871.346296337 | 3 | 3 | 400,372 |
| VAP_BLACK | 16,407 | 1.002670860 | 0.524220997 | 4,588.121745671 | 8,752.266264541 | 0 | 0 | 465,872 |
| VAP_HISPAN | 214,494 | 1.039529522 | 0.543491612 | 61,291.054514992 | 112,772.769853761 | 0 | 0 | 382,634 |
| VAP_ASIAN | 41,758 | 1.001835903 | 0.523784461 | 11,675.136271349 | 22,289.963050474 | 0 | 0 | 457,872 |
| VAP_HAWAII | 14,719 | 1.066307620 | 0.557491861 | 4,269.730612451 | 7,658.821433217 | 0 | 0 | 465,192 |
| VAP_INDIAN | 18,438 | 0.919082992 | 0.480519203 | 4,892.660454868 | 10,182.028998445 | 0 | 0 | 462,182 |
| VAP_MULTI | 21,188 | 1.001159058 | 0.523430590 | 5,921.160443439 | 11,312.217056179 | 0 | 0 | 465,958 |
| VAP_OTHER | 2,286 | 1.005238699 | 0.525563526 | 640.444905762 | 1,218.587047046 | 0 | 0 | 472,348 |
| TOTAL | 1,892,858 | 1 | 0.522824606 | 1,011,058.000000000 | 528,606.000000000 |
Splits
Beaver County
Juab County
Salt Lake County
Utah County