This page was generated on 2016.07.12 by Auto-Redistrict.
vtd_data.txt (tab-delimited)
vtd_data.dbf (dbase/ESRI)
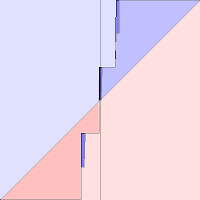

Churchill County
Clark County
Washoe County
VTD district assignments
vtd_data.txt (tab-delimited)
vtd_data.dbf (dbase/ESRI)
Maps (click to enlarge)
| Districts | 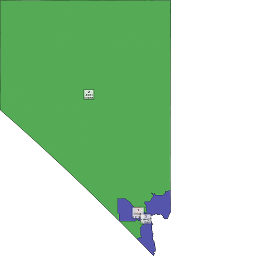 Labeled districts Labeled districts |
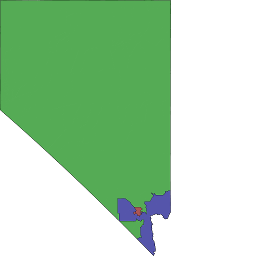 Unlabeled districts Unlabeled districts |
||
| Geometry | 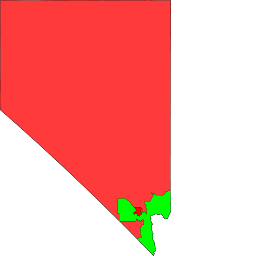 Population difference Population difference |
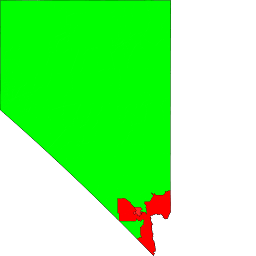 Compactness Compactness |
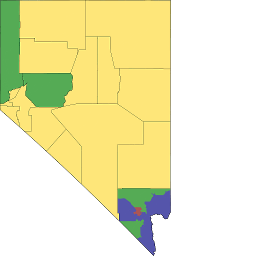 Splits Splits |
|
| Fairness - by district | 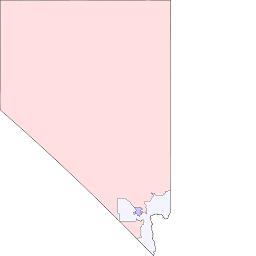 Partisan vote packing Partisan vote packing |
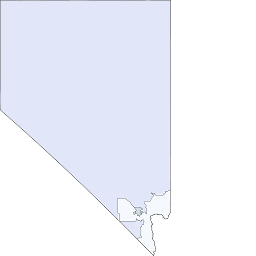 Racial vote packing Racial vote packing |
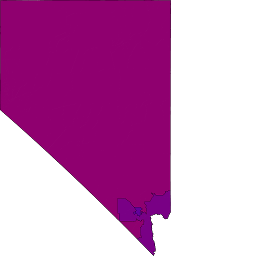 District vote balance District vote balance |
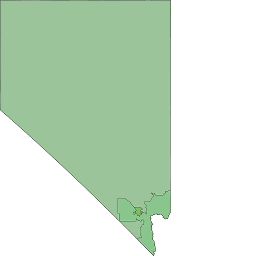 District demographics District demographics |
Fairness - by density | 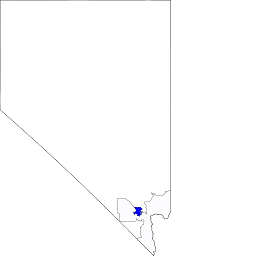 Partisan vote packing Partisan vote packing |
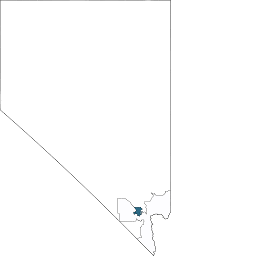 Racial vote packing Racial vote packing |
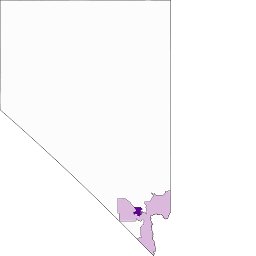 District vote balance District vote balance |
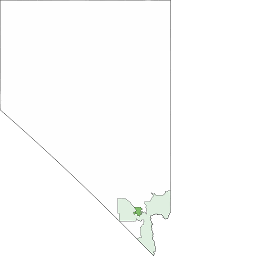 District demographics District demographics |
| VTDs | 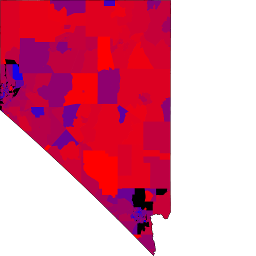 VTD vote balance VTD vote balance |
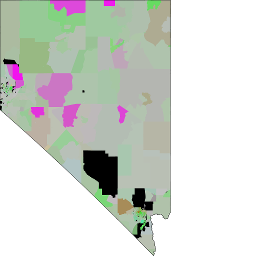 VTD demographics VTD demographics |
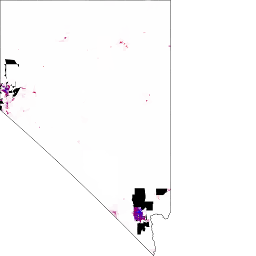 VTD vote balance VTD vote balance(density) |
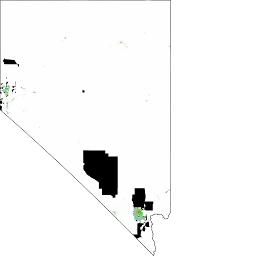 VTD demographics VTD demographics(density) |
Seats / votes curve - Vote packing


Summary
| Value | Measure |
|---|---|
| 0.2597729617892446 | Compactness (isoperimetric quotient) |
| 39,129 | Disconnected population (count) |
| 27.572086820 | Population max deviation (%) |
| 10.696064124 | Population mean deviation (%) |
| 4 | County splits |
| 0.007896924 | Seats / vote asymmetry |
| -1,140.698011768 | Packing/cracking asymmetry (%) |
| 117,736 | Competitiveness (victory margin) |
| 0.191226101 | Disproporionality |
| 0.078194355 | Racial vote dilution |
| 12.217894503 | Efficiency gap (pct) |
| 0.366536835 | Adj. efficiency gap (seats) |
| 816,528 | Undescribed voters |
| 1.0 | FV Safe D |
| 0.0 | FV Lean D |
| 1.0 | FV Tossup |
| 1.0 | FV Lean R |
| 0.0 | FV Safe R |
| 0.673794700 | Mutation rate (%) |
| 33.000000000 | Elitism (%) |
| 0 | Generation (count) |
By party
| Party | Delegates | Pop. vote | Wasted votes | % del | % pop vote |
|---|---|---|---|---|---|
| PRES12_D50 | 2 | 509,335 | 186731 | 0.6666666666666666 | 0.5152813467413957 |
| PRES12_R50 | 1 | 479,125 | 307500 | 0.3333333333333333 | 0.4847186532586043 |
By district
| District | Population | Winner | PVI | Vote gap | Wasted votes | FV Safe D | FV Lean D | FV Tossup | FV Lean R | FV Safe R | Pop per seats | Compactness | Area | Paired edge length | Unpaired edge length | PRES12_D50 vote % | PRES12_R50 vote % | PRES12_D50 votes | PRES12_R50 votes | VAP_WHITE % | VAP_BLACK % | VAP_HISPAN % | VAP_ASIAN % | VAP_HAWAII % | VAP_INDIAN % | VAP_MULTI % | VAP_OTHER % | VAP_WHITE pop | VAP_BLACK pop | VAP_HISPAN pop | VAP_ASIAN pop | VAP_HAWAII pop | VAP_INDIAN pop | VAP_MULTI pop | VAP_OTHER pop |
|---|---|---|---|---|---|---|---|---|---|---|---|---|---|---|---|---|---|---|---|---|---|---|---|---|---|---|---|---|---|---|---|---|---|---|---|
| 1 | 818,839 | 1,0, | D+11 | 56239 | 127492 | 1.0 | 0.0 | 0.0 | 0.0 | 0.0 | 818,839 | 0.21179854196334763 | 3.644756145109597E10 | 1470542.8619056013 | 0.0 | 0.6102799010130087 | 0.3897200989869913 | 155,611 | 99,372 | 0.446583173 | 0.131357551 | 0.321189490 | 0.066649579 | 0.006119666 | 0.004611946 | 0.021836804 | 0.001651791 | 266,578 | 78,411 | 191,727 | 39,785 | 3,653 | 2,753 | 13,035 | 986 |
| 2 | 837,102 | 0,1, | R+6 | 43763 | 171626 | 0.0 | 0.0 | 0.0 | 1.0 | 0.0 | 837,102 | 0.8099789457987935 | 2.2449214130013043E13 | 5174369.47304858 | 1.7984106278263815E7 | 0.4362521886316427 | 0.5637478113683573 | 149,744 | 193,507 | 0.726801940 | 0.026749888 | 0.165715500 | 0.041163533 | 0.003875006 | 0.017699350 | 0.016817743 | 0.001177039 | 464,965 | 17,113 | 106,015 | 26,334 | 2,479 | 11,323 | 10,759 | 753 |
| 3 | 1,044,610 | 1,0, | D+2 | 17734 | 195113 | 0.0 | 0.0 | 1.0 | 0.0 | 0.0 | 1,044,610 | 0.17881160468958054 | 9.634559892870608E11 | 5630780.939361121 | 3463684.7467487957 | 0.5227227299052344 | 0.4772772700947656 | 203,980 | 186,246 | 0.585517866 | 0.071332901 | 0.196266245 | 0.110722091 | 0.006447825 | 0.004732912 | 0.023327834 | 0.001652326 | 467,755 | 56,986 | 156,792 | 88,453 | 5,151 | 3,781 | 18,636 | 1,320 |
By ethnicity
| Ethnicity | Population | Vote dilution | % Wasted votes | Victory margins | Votes | Straight vote descr. rep. | Target seats | Votes for next seat |
|---|---|---|---|---|---|---|---|---|
| VAP_WHITE | 1,199,298 | 0.954785802 | 0.113725048 | 67,305.998188698 | 591,830.904770629 | 3 | 2 | 41,131 |
| VAP_BLACK | 152,510 | 1.169596419 | 0.139311256 | 9,823.090300671 | 70,511.820740898 | 0 | 0 | 430,475 |
| VAP_HISPAN | 454,534 | 1.122543634 | 0.133706773 | 28,796.168771006 | 215,368.062656007 | 0 | 1 | 317,159 |
| VAP_ASIAN | 154,572 | 0.848618613 | 0.101079417 | 7,513.290962077 | 74,330.572456261 | 0 | 0 | 420,433 |
| VAP_HAWAII | 11,283 | 0.975319572 | 0.116170837 | 628.091504586 | 5,406.619452651 | 0 | 0 | 503,735 |
| VAP_INDIAN | 17,857 | 1.031550299 | 0.122868509 | 1,117.881376072 | 9,098.192763246 | 0 | 0 | 497,563 |
| VAP_MULTI | 42,430 | 0.976466056 | 0.116307395 | 2,377.770757429 | 20,443.848478183 | 0 | 0 | 490,250 |
| VAP_OTHER | 3,059 | 0.992108007 | 0.118170516 | 173.708139461 | 1,469.978682125 | 0 | 0 | 507,566 |
| TOTAL | 2,035,543 | 1 | 0.119110536 | 988,460.000000000 | 117,736.000000000 |
Splits
Churchill County
Clark County
Washoe County