This page was generated on 2016.07.12 by Auto-Redistrict.
vtd_data.txt (tab-delimited)
vtd_data.dbf (dbase/ESRI)
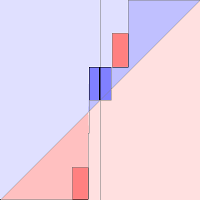

Butler County
Cedar County
Dixon County
Douglas County
Lancaster County
Platte County
Saline County
Sarpy County
Saunders County
Seward County
Stanton County
Wayne County
VTD district assignments
vtd_data.txt (tab-delimited)
vtd_data.dbf (dbase/ESRI)
Maps (click to enlarge)
| Districts | 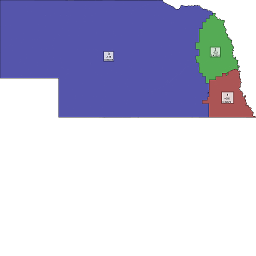 Labeled districts Labeled districts |
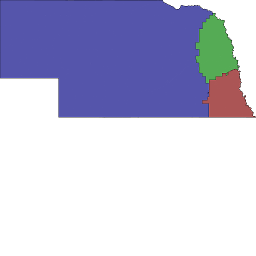 Unlabeled districts Unlabeled districts |
||
| Geometry | 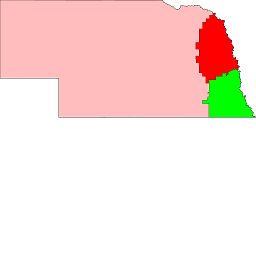 Population difference Population difference |
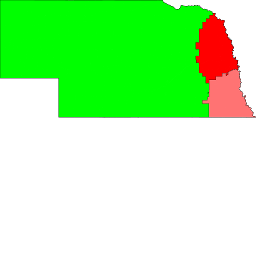 Compactness Compactness |
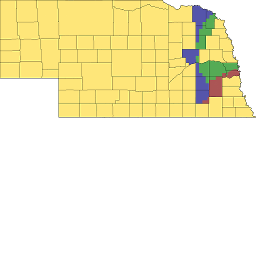 Splits Splits |
|
| Fairness - by district | 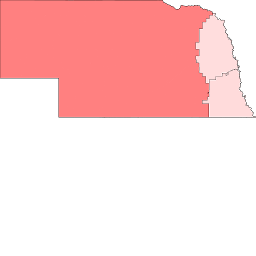 Partisan vote packing Partisan vote packing |
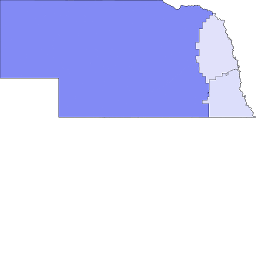 Racial vote packing Racial vote packing |
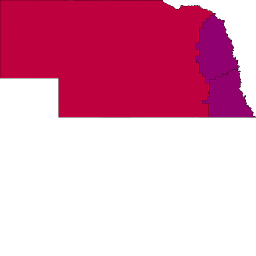 District vote balance District vote balance |
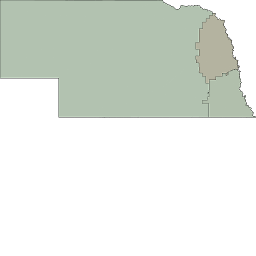 District demographics District demographics |
Fairness - by density | 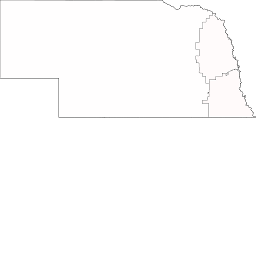 Partisan vote packing Partisan vote packing |
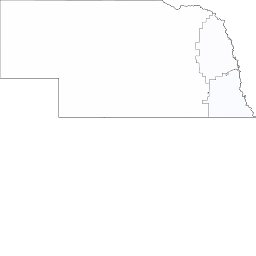 Racial vote packing Racial vote packing |
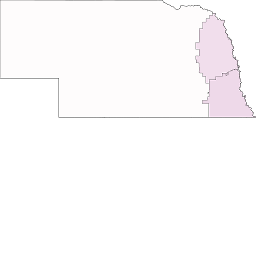 District vote balance District vote balance |
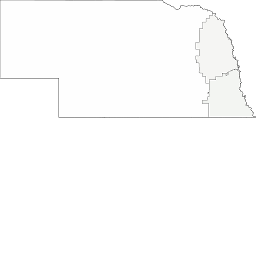 District demographics District demographics |
| VTDs | 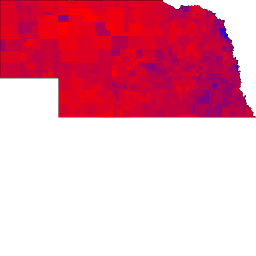 VTD vote balance VTD vote balance |
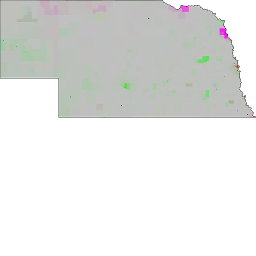 VTD demographics VTD demographics |
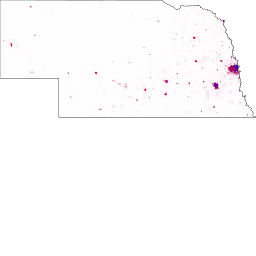 VTD vote balance VTD vote balance(density) |
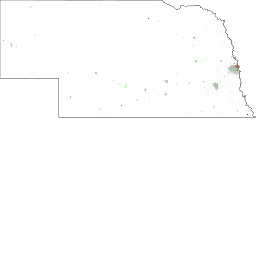 VTD demographics VTD demographics(density) |
Seats / votes curve - Vote packing


Summary
| Value | Measure |
|---|---|
| 0.5348276895846422 | Compactness (isoperimetric quotient) |
| 1,917 | Disconnected population (count) |
| 0.194490158 | Population max deviation (%) |
| 0.072239157 | Population mean deviation (%) |
| 12 | County splits |
| 0.045303408 | Seats / vote asymmetry |
| -5,261.863650616 | Packing/cracking asymmetry (%) |
| 192,238 | Competitiveness (victory margin) |
| 0.185199501 | Disproporionality |
| 0.052256827 | Racial vote dilution |
| 24.632427653 | Efficiency gap (pct) |
| 0.738972830 | Adj. efficiency gap (seats) |
| 0 | Undescribed voters |
| 0.0 | FV Safe D |
| 0.0 | FV Lean D |
| 0.0 | FV Tossup |
| 2.0 | FV Lean R |
| 1.0 | FV Safe R |
| 0.673794700 | Mutation rate (%) |
| 33.000000000 | Elitism (%) |
| 0 | Generation (count) |
By party
| Party | Delegates | Pop. vote | Wasted votes | % del | % pop vote |
|---|---|---|---|---|---|
| PRES12_D50 | 0 | 282,786 | 282786 | 0.0 | 0.3731621382668479 |
| PRES12_R50 | 3 | 475,024 | 96120 | 1.0 | 0.6268378617331521 |
By district
| District | Population | Winner | PVI | Vote gap | Wasted votes | FV Safe D | FV Lean D | FV Tossup | FV Lean R | FV Safe R | Pop per seats | Compactness | Area | Paired edge length | Unpaired edge length | PRES12_D50 vote % | PRES12_R50 vote % | PRES12_D50 votes | PRES12_R50 votes | VAP_WHITE % | VAP_BLACK % | VAP_HISPAN % | VAP_ASIAN % | VAP_HAWAII % | VAP_INDIAN % | VAP_MULTI % | VAP_OTHER % | VAP_WHITE pop | VAP_BLACK pop | VAP_HISPAN pop | VAP_ASIAN pop | VAP_HAWAII pop | VAP_INDIAN pop | VAP_MULTI pop | VAP_OTHER pop |
|---|---|---|---|---|---|---|---|---|---|---|---|---|---|---|---|---|---|---|---|---|---|---|---|---|---|---|---|---|---|---|---|---|---|---|---|
| 1 | 609,440 | 0,1, | R+7 | 37595 | 129755 | 0.0 | 0.0 | 0.0 | 1.0 | 0.0 | 609,440 | 0.4987273788234929 | 1.0331773978623408E12 | 2804911.8243151507 | 3063102.5426170398 | 0.4275651326158245 | 0.5724348673841755 | 110,957 | 148,552 | 0.860285275 | 0.029553951 | 0.067826208 | 0.024756599 | 0.000565418 | 0.005012646 | 0.011121332 | 0.000878572 | 395,591 | 13,590 | 31,189 | 11,384 | 260 | 2,305 | 5,114 | 404 |
| 2 | 608,257 | 0,1, | R+7 | 34897 | 129702 | 0.0 | 0.0 | 0.0 | 1.0 | 0.0 | 608,257 | 0.4235098368742399 | 1.2215466936341758E12 | 4182666.5066407467 | 2450364.374118356 | 0.43273593597606813 | 0.5672640640239319 | 112,253 | 147,150 | 0.795716009 | 0.086087042 | 0.075628513 | 0.021204110 | 0.000585233 | 0.009599594 | 0.010218205 | 0.000961295 | 357,590 | 38,687 | 33,987 | 9,529 | 263 | 4,314 | 4,592 | 432 |
| 3 | 608,644 | 0,1, | R+25 | 119746 | 119449 | 0.0 | 0.0 | 0.0 | 0.0 | 1.0 | 608,644 | 0.8045314228160625 | 1.3958851782277617E13 | 4161543.5139257796 | 1.4139067249063287E7 | 0.2493783958007183 | 0.7506216041992817 | 59,576 | 179,322 | 0.903657873 | 0.005905361 | 0.072168146 | 0.005468574 | 0.000355981 | 0.006591117 | 0.005394320 | 0.000458626 | 413,775 | 2,704 | 33,045 | 2,504 | 163 | 3,018 | 2,470 | 210 |
By ethnicity
| Ethnicity | Population | Vote dilution | % Wasted votes | Victory margins | Votes | Straight vote descr. rep. | Target seats | Votes for next seat |
|---|---|---|---|---|---|---|---|---|
| VAP_WHITE | 1,166,956 | 1.027851035 | 0.260740855 | 168,319.942178070 | 645,544.949869792 | 3 | 3 | 269,785 |
| VAP_BLACK | 54,981 | 0.605195283 | 0.153523351 | 4,822.403666485 | 31,411.532058383 | 0 | 0 | 303,093 |
| VAP_HISPAN | 98,221 | 1.001132735 | 0.253963071 | 13,830.981267122 | 54,460.600218492 | 0 | 0 | 307,793 |
| VAP_ASIAN | 23,417 | 0.692844993 | 0.175757955 | 2,325.524056866 | 13,231.401439211 | 0 | 0 | 330,396 |
| VAP_HAWAII | 686 | 0.866409560 | 0.219787072 | 84.307098004 | 383.585336530 | 0 | 0 | 341,517 |
| VAP_INDIAN | 9,637 | 0.964430934 | 0.244652715 | 1,312.707357910 | 5,365.594892311 | 0 | 0 | 337,466 |
| VAP_MULTI | 12,176 | 0.820495404 | 0.208139765 | 1,420.639477228 | 6,825.411168254 | 0 | 0 | 336,666 |
| VAP_OTHER | 1,046 | 0.816011939 | 0.207002419 | 121.494898315 | 586.925017027 | 0 | 0 | 341,348 |
| TOTAL | 1,367,120 | 1 | 0.253675723 | 757,810.000000000 | 192,238.000000000 |
Splits
Butler County
Cedar County
Dixon County
Douglas County
Lancaster County
Platte County
Saline County
Sarpy County
Saunders County
Seward County
Stanton County
Wayne County