This page was generated on 2016.07.12 by Auto-Redistrict.
vtd_data.txt (tab-delimited)
vtd_data.dbf (dbase/ESRI)


Ada County
Bingham County
Blaine County
Bonneville County
Canyon County
Elmore County
Gooding County
Minidoka County
Owyhee County
VTD district assignments
vtd_data.txt (tab-delimited)
vtd_data.dbf (dbase/ESRI)
Maps (click to enlarge)
| Districts | 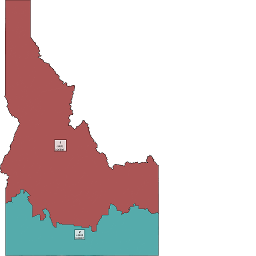 Labeled districts Labeled districts |
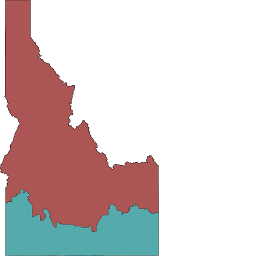 Unlabeled districts Unlabeled districts |
||
| Geometry | 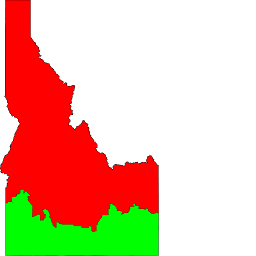 Population difference Population difference |
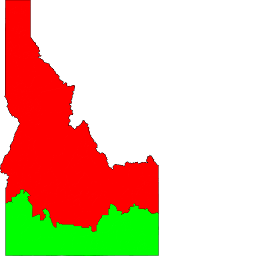 Compactness Compactness |
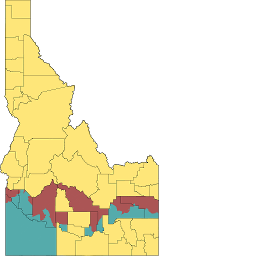 Splits Splits |
|
| Fairness - by district | 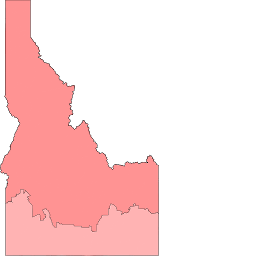 Partisan vote packing Partisan vote packing |
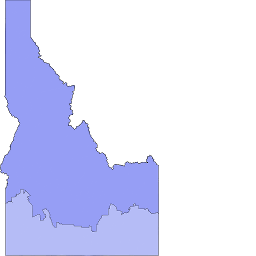 Racial vote packing Racial vote packing |
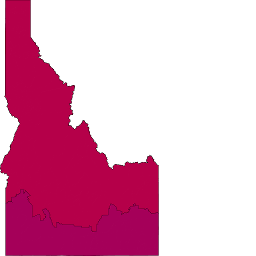 District vote balance District vote balance |
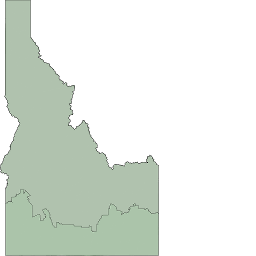 District demographics District demographics |
Fairness - by density |  Partisan vote packing Partisan vote packing |
 Racial vote packing Racial vote packing |
 District vote balance District vote balance |
 District demographics District demographics |
| VTDs | 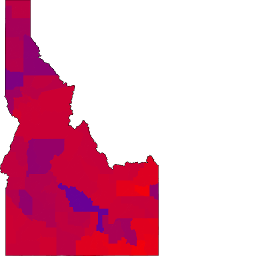 VTD vote balance VTD vote balance |
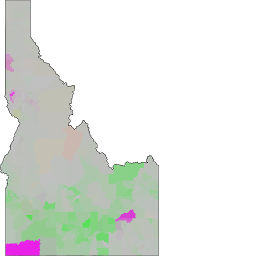 VTD demographics VTD demographics |
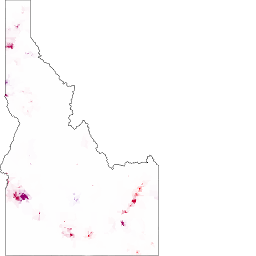 VTD vote balance VTD vote balance(density) |
 VTD demographics VTD demographics(density) |
Seats / votes curve - Vote packing


Summary
| Value | Measure |
|---|---|
| 0.27696083235553653 | Compactness (isoperimetric quotient) |
| 0 | Disconnected population (count) |
| 0.892466959 | Population max deviation (%) |
| 0.444251082 | Population mean deviation (%) |
| 9 | County splits |
| 0.001246883 | Seats / vote asymmetry |
| 0.000000000 | Packing/cracking asymmetry (%) |
| 233,393 | Competitiveness (victory margin) |
| 0.216907731 | Disproporionality |
| 0.005693478 | Racial vote dilution |
| 13.642155801 | Efficiency gap (pct) |
| 0.272843116 | Adj. efficiency gap (seats) |
| 0 | Undescribed voters |
| 0.0 | FV Safe D |
| 0.0 | FV Lean D |
| 0.0 | FV Tossup |
| 0.0 | FV Lean R |
| 2.0 | FV Safe R |
| 0.673794700 | Mutation rate (%) |
| 33.000000000 | Elitism (%) |
| 0 | Generation (count) |
By party
| Party | Delegates | Pop. vote | Wasted votes | % del | % pop vote |
|---|---|---|---|---|---|
| PRES12_D50 | 0 | 204,270 | 204270 | 0.0 | 0.31821077900653183 |
| PRES12_R50 | 2 | 437,663 | 116697 | 1.0 | 0.6817892209934682 |
By district
| District | Population | Winner | PVI | Vote gap | Wasted votes | FV Safe D | FV Lean D | FV Tossup | FV Lean R | FV Safe R | Pop per seats | Compactness | Area | Paired edge length | Unpaired edge length | PRES12_D50 vote % | PRES12_R50 vote % | PRES12_D50 votes | PRES12_R50 votes | VAP_WHITE % | VAP_BLACK % | VAP_HISPAN % | VAP_ASIAN % | VAP_HAWAII % | VAP_INDIAN % | VAP_MULTI % | VAP_OTHER % | VAP_WHITE pop | VAP_BLACK pop | VAP_HISPAN pop | VAP_ASIAN pop | VAP_HAWAII pop | VAP_INDIAN pop | VAP_MULTI pop | VAP_OTHER pop |
|---|---|---|---|---|---|---|---|---|---|---|---|---|---|---|---|---|---|---|---|---|---|---|---|---|---|---|---|---|---|---|---|---|---|---|---|
| 1 | 780,309 | 0,1, | R+21 | 136539 | 160575 | 0.0 | 0.0 | 0.0 | 0.0 | 1.0 | 780,309 | 0.265876469022072 | 1.2302658044230959E13 | 9432666.60912896 | 1.957475587818573E7 | 0.28742110359988665 | 0.7125788964001133 | 92,305 | 228,844 | 0.882971376 | 0.003073765 | 0.080931991 | 0.008065574 | 0.000841002 | 0.011177805 | 0.012207638 | 0.000730850 | 505,004 | 1,758 | 46,288 | 4,613 | 481 | 6,393 | 6,982 | 418 |
| 2 | 787,273 | 0,1, | R+15 | 96854 | 160392 | 0.0 | 0.0 | 0.0 | 0.0 | 1.0 | 787,273 | 0.289009614191499 | 4.846597028073939E12 | 9432666.60912896 | 6778681.811874069 | 0.34903548805426704 | 0.6509645119457329 | 111,965 | 208,819 | 0.849890482 | 0.006883491 | 0.099718836 | 0.016945742 | 0.001825008 | 0.010927100 | 0.012912723 | 0.000896619 | 481,525 | 3,900 | 56,498 | 9,601 | 1,034 | 6,191 | 7,316 | 508 |
By ethnicity
| Ethnicity | Population | Vote dilution | % Wasted votes | Victory margins | Votes | Straight vote descr. rep. | Target seats | Votes for next seat |
|---|---|---|---|---|---|---|---|---|
| VAP_WHITE | 986,529 | 1.003235135 | 0.364754667 | 202,875.321471112 | 556,196.642845982 | 2 | 2 | 254,003 |
| VAP_BLACK | 5,658 | 0.935146656 | 0.339999164 | 1,086.382427674 | 3,195.250287803 | 0 | 0 | 375,603 |
| VAP_HISPAN | 102,786 | 0.982375231 | 0.357170456 | 20,708.541216690 | 57,979.434949317 | 0 | 0 | 323,005 |
| VAP_ASIAN | 14,214 | 0.939819443 | 0.341698089 | 2,742.528277206 | 8,026.173882443 | 0 | 0 | 369,902 |
| VAP_HAWAII | 1,515 | 0.937437943 | 0.340832227 | 291.588814471 | 855.520081398 | 0 | 0 | 378,469 |
| VAP_INDIAN | 12,584 | 1.001922003 | 0.364277241 | 2,584.539627986 | 7,094.979696529 | 0 | 0 | 373,110 |
| VAP_MULTI | 14,298 | 0.995243297 | 0.361849007 | 2,917.467557382 | 8,062.665634498 | 0 | 0 | 372,187 |
| VAP_OTHER | 926 | 0.982737651 | 0.357302224 | 186.630607479 | 522.332622031 | 0 | 0 | 378,995 |
| TOTAL | 1,138,510 | 1 | 0.363578442 | 641,933.000000000 | 233,393.000000000 |
Splits
Ada County
Bingham County
Blaine County
Bonneville County
Canyon County
Elmore County
Gooding County
Minidoka County
Owyhee County